Streamline Financial Decision‑Making With Construction Data Analytics Software
Get a clear view of project costs without juggling disconnected spreadsheets or waiting on stale reports. Learn how construction data analytics software can help you make faster, more confident decisions in real time.


Table of Contents
Streamline Financial Decision-Making With Construction Data Analytics Software
Manual spreadsheets, disconnected systems, and slow reporting cycles still define how many construction teams manage their financial data. According to one report from FMI, the industry captures vast amounts of information each day, yet nearly 96% of it goes unused, leaving leaders without the insights they need.
For CFOs, that gap creates real risk exposure: unclear job profitability, inaccurate forecasts, and decisions made long after problems have already taken root. Construction data analytics software closes these blind spots by centralizing information, accelerating reporting, and giving finance teams the clarity to act with confidence.
What Exactly Is Construction Data Analytics Software?
Construction data analytics software is a centralized platform that continuously collects, connects, and analyzes project and financial data. Standard reporting tools and static spreadsheets often keep sales, finance, and operations data siloed from one another, but construction analytics software like ContractorBI™ integrates it all into one unified view.
Instead of relying on manual exports and disconnected files, it automates data flows and creates dynamic dashboards that update in real-time, reducing the hours spent gathering information and accelerating how quickly project managers and CFOs can spot trends or issues.
The difference shows up in day-to-day decisions. Instead of waiting for a month-end cost report, a CFO might open their project performance dashboard on a Wednesday morning and immediately see a labor overrun developing on a high-value job, giving them the chance to intervene before profitability slips.
Construction analytics is evolving to provide actionable insight that drives better decision-making and collaboration among stakeholders. Construction analytics software should offer strong data integration, real-time reporting, predictive analytics, visualization tools, and mobile accessibility.
Core Capabilities for Finance Leaders
Construction data analytics software gives finance leaders three core capabilities that are nearly impossible to achieve with traditional reporting or static spreadsheets:
First, it enables seamless data integration by pulling together financial information from your ERP, project status updates from your PM system, and field data from job sites. ContractorBI integrates with leading solutions like Sage and Procore to improve visibility and collaboration across teams. The software you choose should be scalable and easily integrate with your existing systems to maximize return on investment.
Second, it delivers real-time data dashboards and visualizations, so you can immediately see cash flow issues, cost variances, or emerging risks without waiting for end-of-month manual reporting.
Finally, it offers predictive analytics and scenario modeling, using both historical and current data to forecast future outcomes, whether that’s projecting labor cost overrun or testing “what-if” scenarios around bidding, budgeting, or risk.
Key Metrics Finance Teams Can Track With Construction Data Analytics Software
The right data at the right time is the difference between a profitable decision and a missed opportunity. But data alone isn’t enough; you need the right tool to turn scattered data into a unified view with clear insights.
With the right tools surfacing the right information at the right time, you’ll be able to see:
- Profitability by job type or project category
- Revenue forecasting and pipeline health metrics
- Budget vs. actuals, cost overruns, and margin trends
- Cash flow forecasting and backlog visibility
Real-time dashboards that show these crucial metrics help contractors, finance managers, and executives detect potential problems early or avoid them altogether. ContractorBI takes this a step further with role-specific dashboards that provide each stakeholder with perspective that matters most to them, saving everyone time on digging through data.
The Business Impact: Faster, More Confident Decisions
Think about this: FMI reports that 13% of construction teams’ working hours are spent looking for project data and information when they’re using siloed and static systems. And we all know the saying: time is money.
Leveraging a data analytics platform can have a dramatic business impact. Imagine spotting a downward-margin trend mid-project using live dashboards, then quickly reallocating resources before profitability slips. For both general and specialty contractors, the result is fewer surprises and more predictable outcomes, improved forecasting accuracy, reduced errors, and increased profitability.
Transitioning from Spreadsheets to Real-Time Analytics
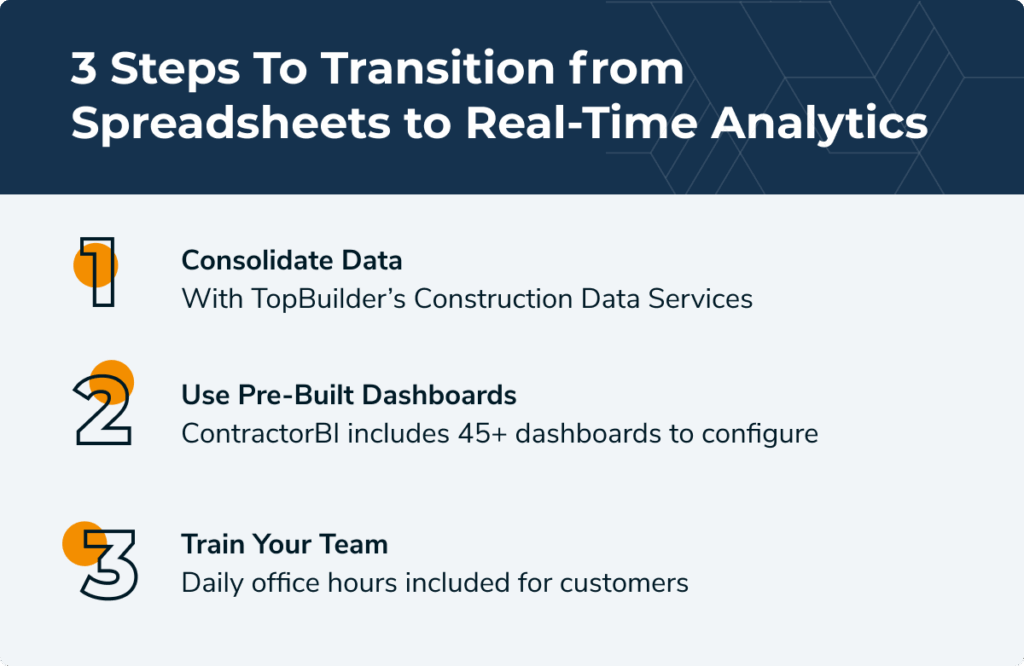
Step 1: Consolidate Your Data Into One Platform
Merge ERP, project, field, and financial data into a unified analytics engine that gives your team a single, reliable source of truth. TopBuilder’s
Construction Data Services makes this process as seamless as possible by loading and cleaning up your data, reconciling records across systems, and hosting everything securely with automatic backups and syncs.
Step 2: Deploy Pre-Built Dashboards and Configure Custom Views
With the right platform, your team won’t need to build these dashboards from scratch. Templates like budget vs. actuals and pipeline health can get your team up to speed quickly. ContractorBI provides 45+ pre-built dashboards tailored to the nuances of the construction industry.
Step 3: Adopt a Culture of Data-Driven Decision-Making
Shifting away from legacy systems and long-standing routines can be a significant cultural adjustment, so helping your team confidently adopt new tools is important. Clear training, consistent dashboard reviews, and embedding analytics into everyday workflows allow for insights to be actively used to guide decisions and improve project outcomes.
Common Pitfalls & How To Avoid Them
The most common issues teams face when adopting new construction analytics software are:
- Over‑customizing early
- Ignoring data governance
- Relying solely on historical reports instead of forward‑looking insights.
To avoid derailing progress with adoption and use, teams can start with standardized workflows, establish clear data ownership, and prioritize predictive metrics and key performance indicators from the beginning.
Why Construction Analytics Software Matters
When your project management software is siloed from actionable business intelligence data, it’s difficult for teams to monitor project performance or analyze historical data to improve future outcomes.
Many teams have already adopted business intelligence tools like Power BI, but struggle to implement them because the tools don’t inherently understand the nuances of the construction industry. Things like job-cost structure, subcontractor flows, and backlog logic aren’t factored in, making generic tools cumbersome for teams to implement and use consistently.
These tools can be notoriously difficult to use, even requiring IT teams for setup and ongoing use. Powerful platforms are useless if nobody uses them.
By contrast, construction-specific platforms are designed with construction finance workflows in mind, so standard metrics and statuses such as budget vs. actuals, WIP, bonding capacity, or backlog are ready to access as soon as your team’s data is integrated. For a smooth rollout, ask software providers about their onboarding process and ongoing support.
ContractorBI is built for construction firms, making it faster to implement, easier to adopt, and ready to integrate with tools like Sage, Procore, Autodesk Construction Cloud. When you consider that most CFOs spend more than half of their time chasing data instead of analyzing it, having a tool at your fingertips that already understands what you’re looking for and delivers data insights automatically is crucial.
And because ContractorBI can pull clean, structured data directly from your existing construction finance systems on day one, CFOs begin seeing measurable ROI within weeks through faster reporting cycles, earlier visibility into margin erosion, and fewer hours lost to manual data collection.
Turn Complex Data Into Smarter Finance Reporting
Leave spreadsheets behind and gain real-time visibility into every project and financial trend. ContractorBI gives construction finance teams the clarity to stop chasing data and start making proactive, margin-protecting decisions. If you’re ready to experience faster reporting, earlier insights, and a more confident financial workflow, start your free trial today.
Related Content

Project Bidding Made Easy for Electrical Contractors

Stop Wasting Time Chasing Dead Ends: Simplify Construction Bidding