Topbuilder Solution
Topbuilder featured Resource

10 Core
Construction
Dashboards

That Impact Growth and Profitability

The right data at the right time makes the difference between a profitable decision and a missed opportunity. But data alone isn’t enough: without the right business intelligence tools, it’s a struggle to make sense of scattered information across spreadsheets, accounting software, estimating tools, and CRM systems.

Construction-Estimating
That’s where ContractorBI™ comes in.

Designed and built specifically for contractors, ContractorBI provides pre-built, interactive dashboards that turn raw data into clear, actionable insights. You can also create custom dashboards to monitor your company’s most important metrics. Instead of spending hours compiling reports, instantly visualize performance, track trends, and make decisions that drive growth and profitability right away. With one centralized data hub, these construction dashboards help you spot trends and potential issues early.

TopBuilder ContractorBI takes all your siloed data and turns it into construction analytics dashboards for better project management.


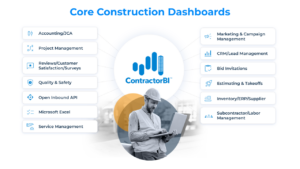
Here are the top 10 essential construction dashboards that can immediately impact your business. 


1. Executive Insights

1. Executive Insights

A high-level snapshot of overall company health and performance.

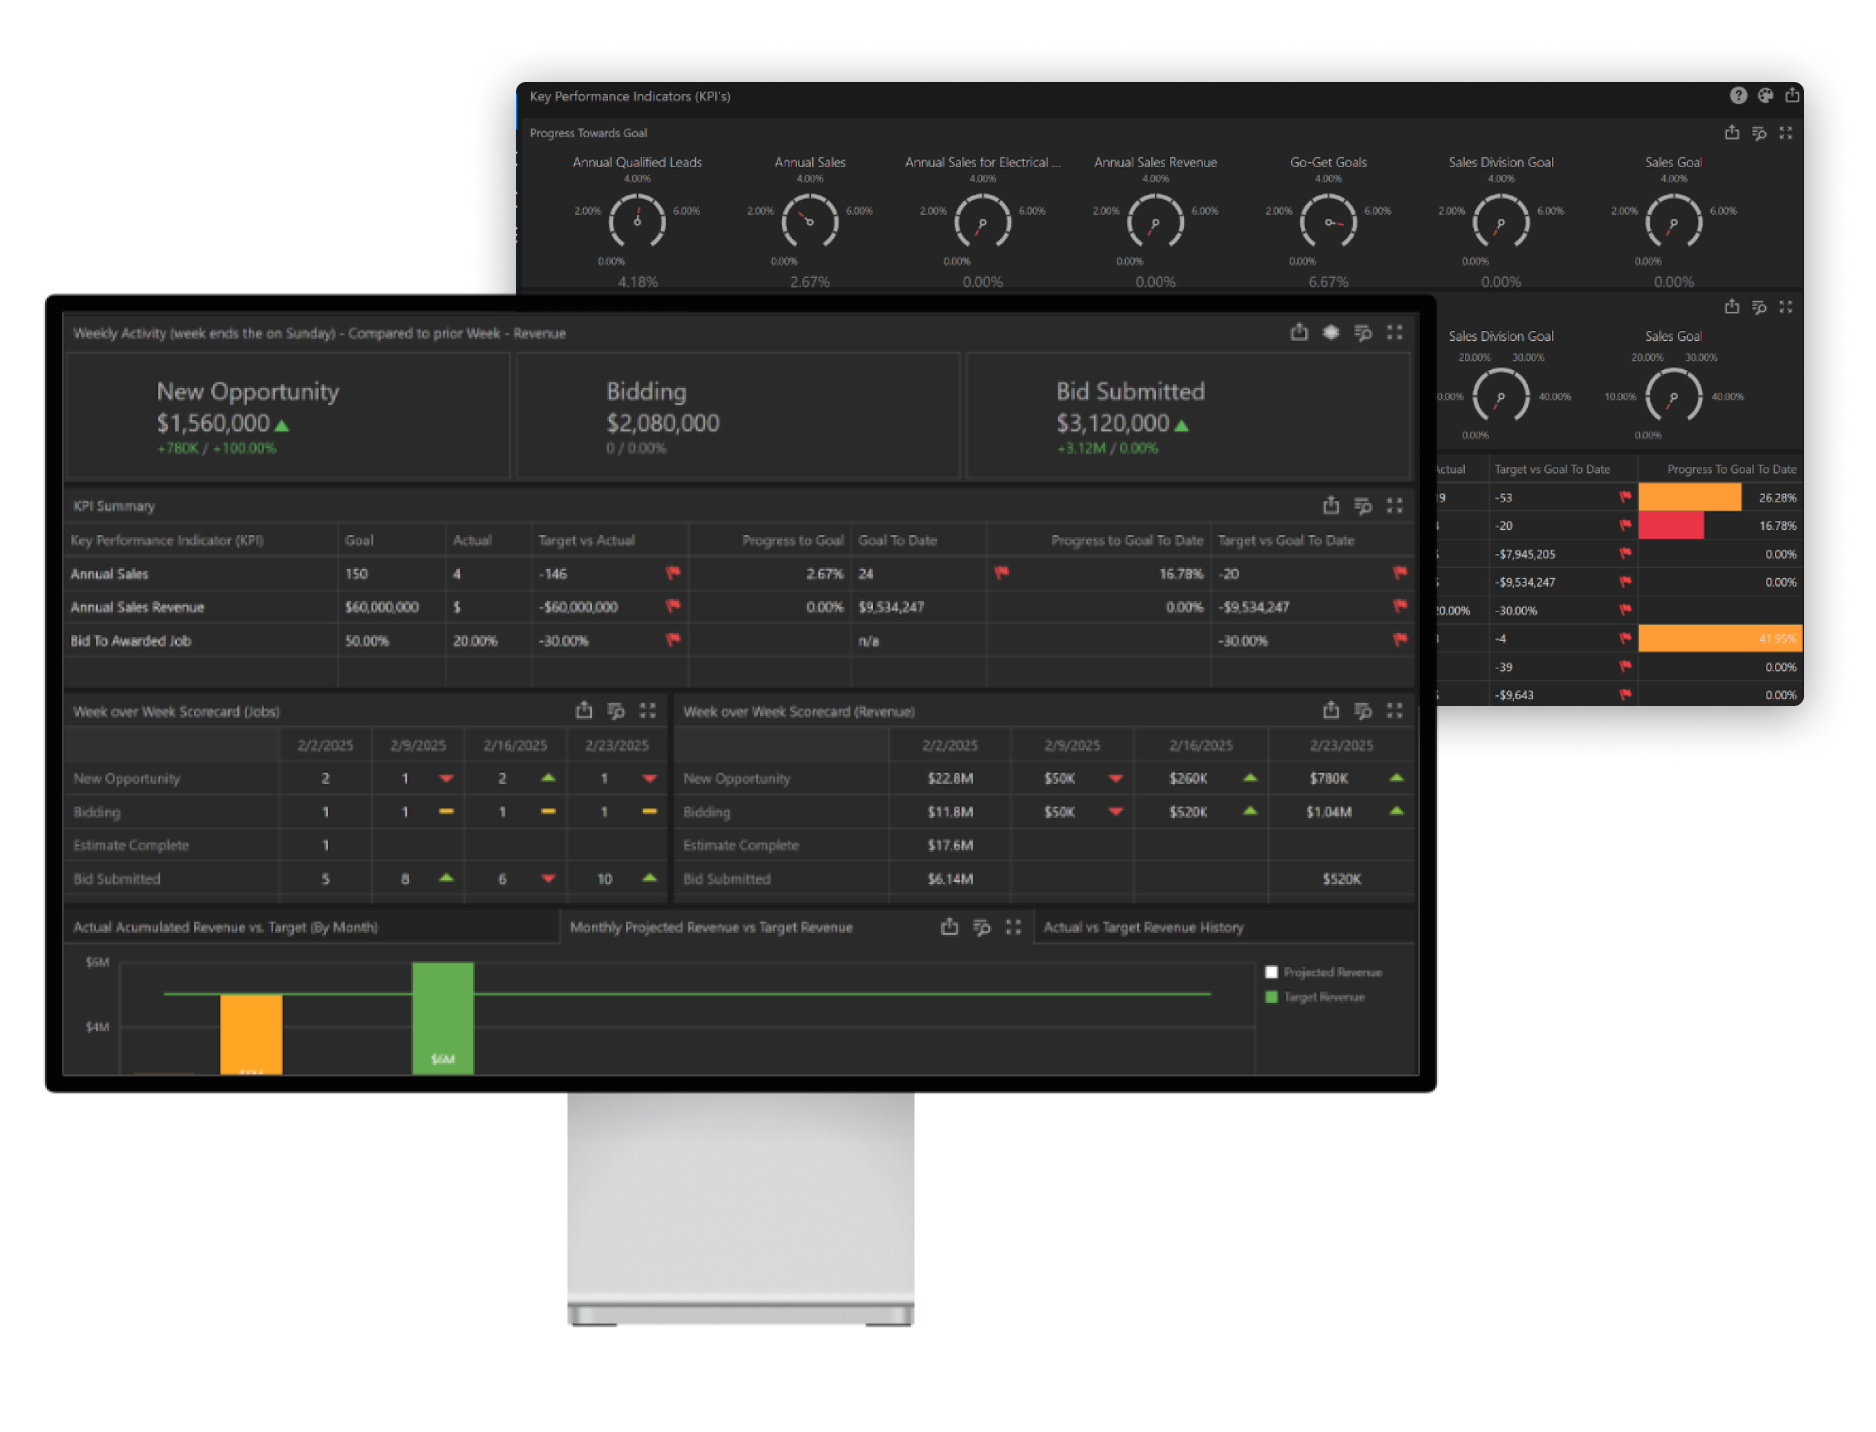
Executive Insights Dashboard - ContractorBI

Who Uses This Dashboard?

  • Owners and stakeholders
  • Executives and senior leadership
  • Business development teams

Key Metrics Provided

  • Weekly Executive Scorecard (weekly bidding/sales activity, trends week over week, KPI performance summary, monthly revenue projections vs actual)
  • KPI tracking (progress against goals and goals to date)
  • Financial Performance Summary (budget vs actual, cost variances, cost performance index, cost type performance)

Why It Matters

The Executive Insights Dashboard provides a weekly business snapshot, helping you track sales, bidding, and revenue trends in real-time. Being able to spot early warning signs and track progress against goals means you can quickly pivot strategies to maintain profitability.

This addresses pain points like:

  • Lack of real-time visibility into company activities and performance
  • Inability to track progress against key metrics (KPI’s)
  • Inability to forecast and predict financial conditions 
  • Inability to identify project and financial risks
This addresses pain points like:

Key Questions Answered

  • What key activities took place last week, and how do they compare to weeks prior?
  • Are we on track to meet our sales and revenue goals?
  • Where are we ahead or falling behind, and what’s causing these trends?
  • What immediate actions are needed to hit our targets?
2. Project Performance

2. Project Performance

Keep projects on schedule, within budget, and performing efficiently.

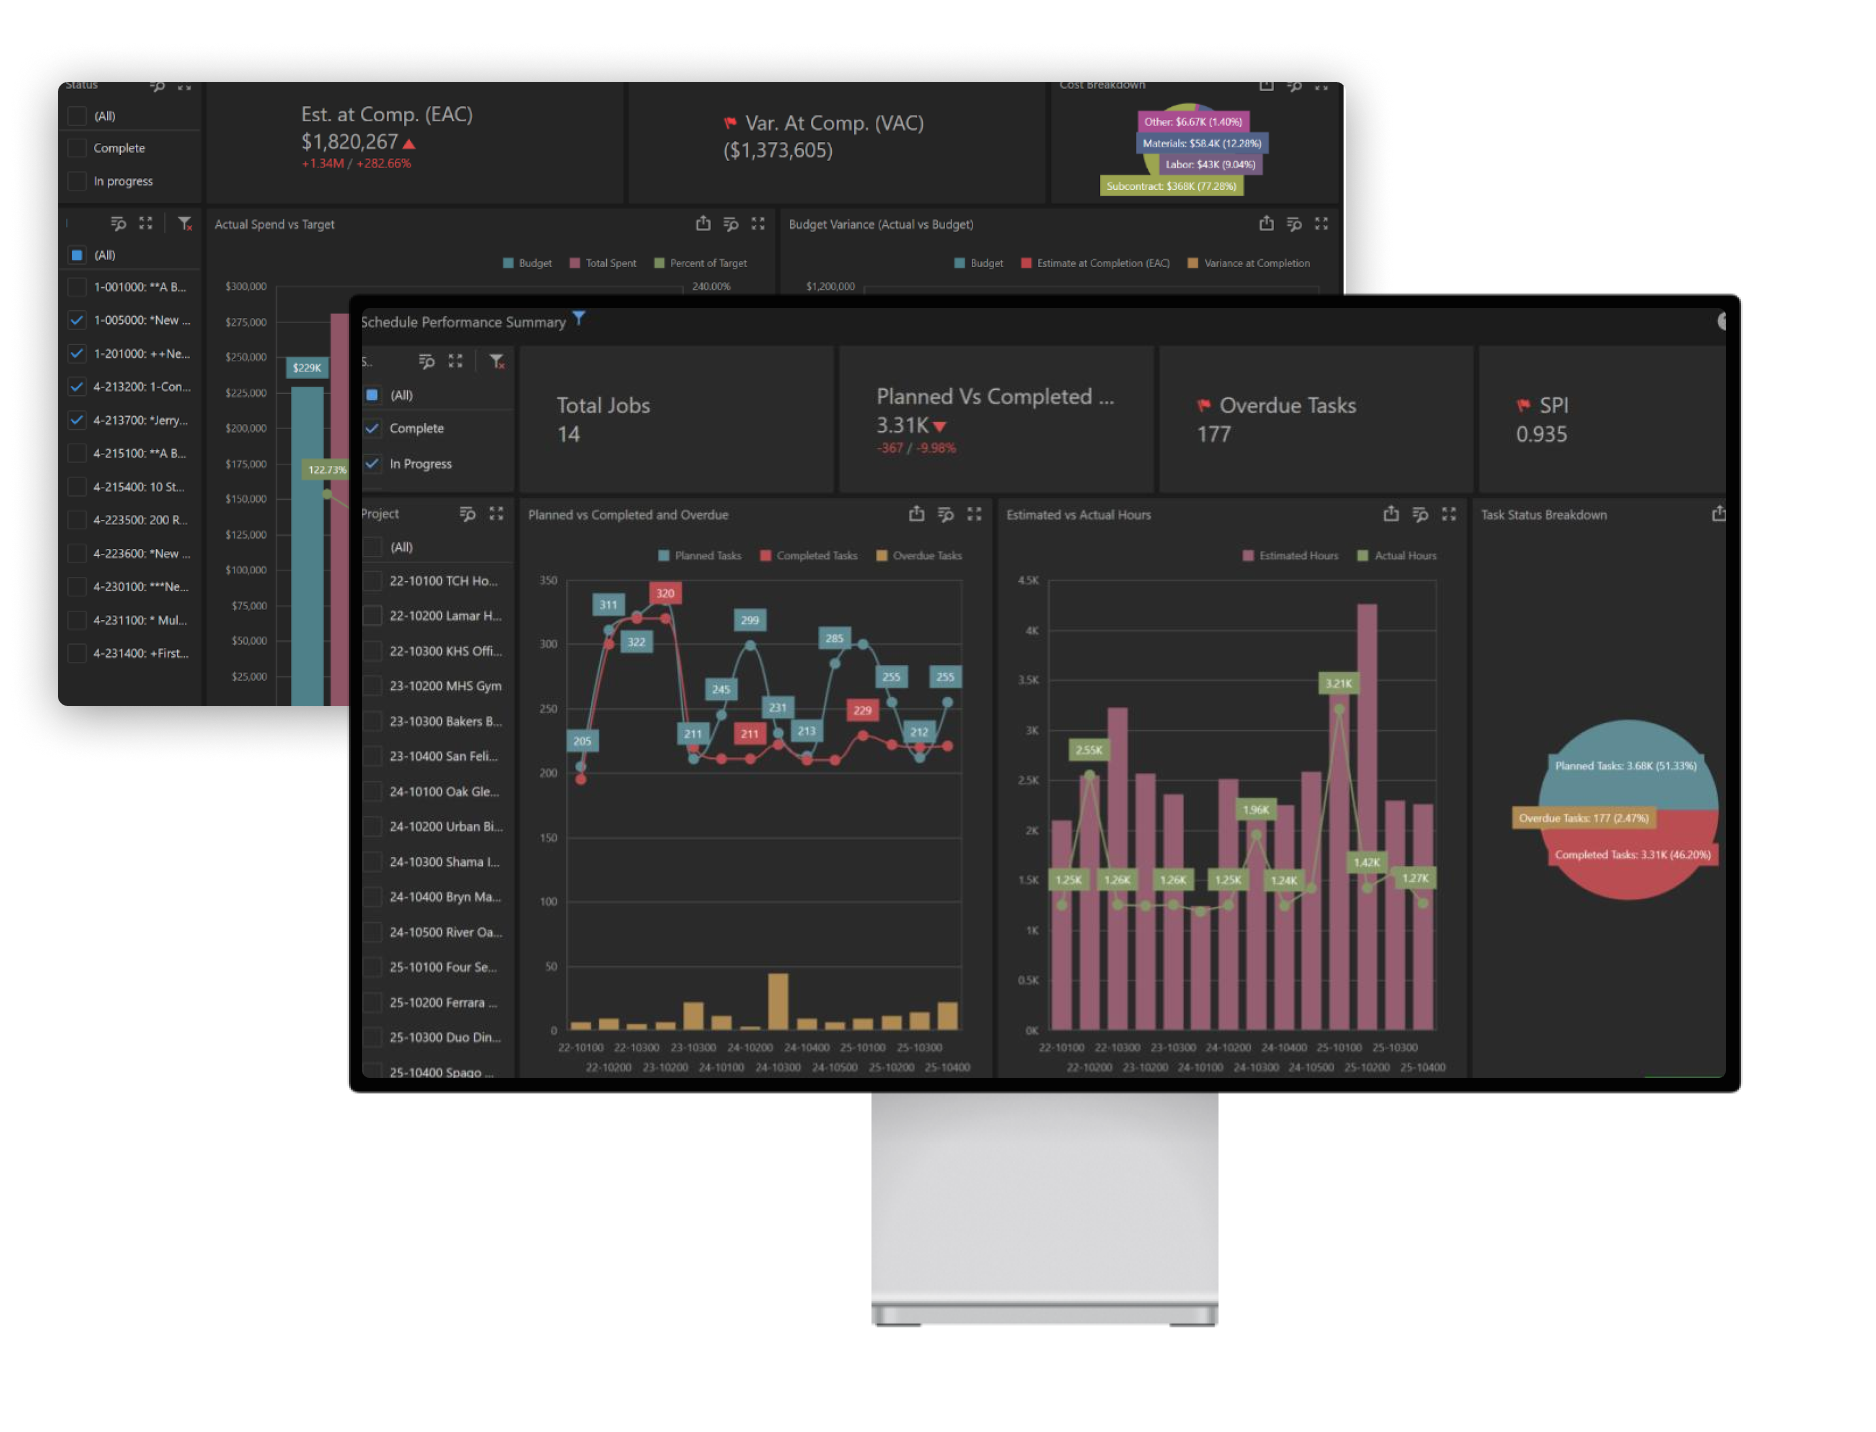
Project Performance Dashboard - ContractorBI

Who Uses This Dashboard?

  • Executives and senior leadership
  • Sales and business development teams
  • Estimators and project managers

Key Metrics Provided

  • Project timeline vs. actual progress
  • Budget vs. actual costs
  • Percentage of work completed
  • Labor productivity (hours worked vs. output)
  • Subcontractor performance
  • Individual Project Performance

Why It Matters

This dashboard gives you a live look at project timelines, labor productivity, subcontractor performance, and budget status, helping you make informed decisions. Instead of reacting to issues after they happen, you and your team can spot trends early and take proactive action.

This addresses pain points like:

  • Schedule delays 
  • Cost overruns
  • Labor productivity issues
  • Poor subcontractor performance
This addresses pain points like:

Key Questions Answered

  • Are projects running on time and on budget?
  • Are we utilizing labor and subcontractors efficiently?
  • Where are delays or overages occurring, and why?
3. Financial Health & Performance Dashboard

3. Financial Health & Performance Dashboard

See the big picture and stay in control of your financial future.

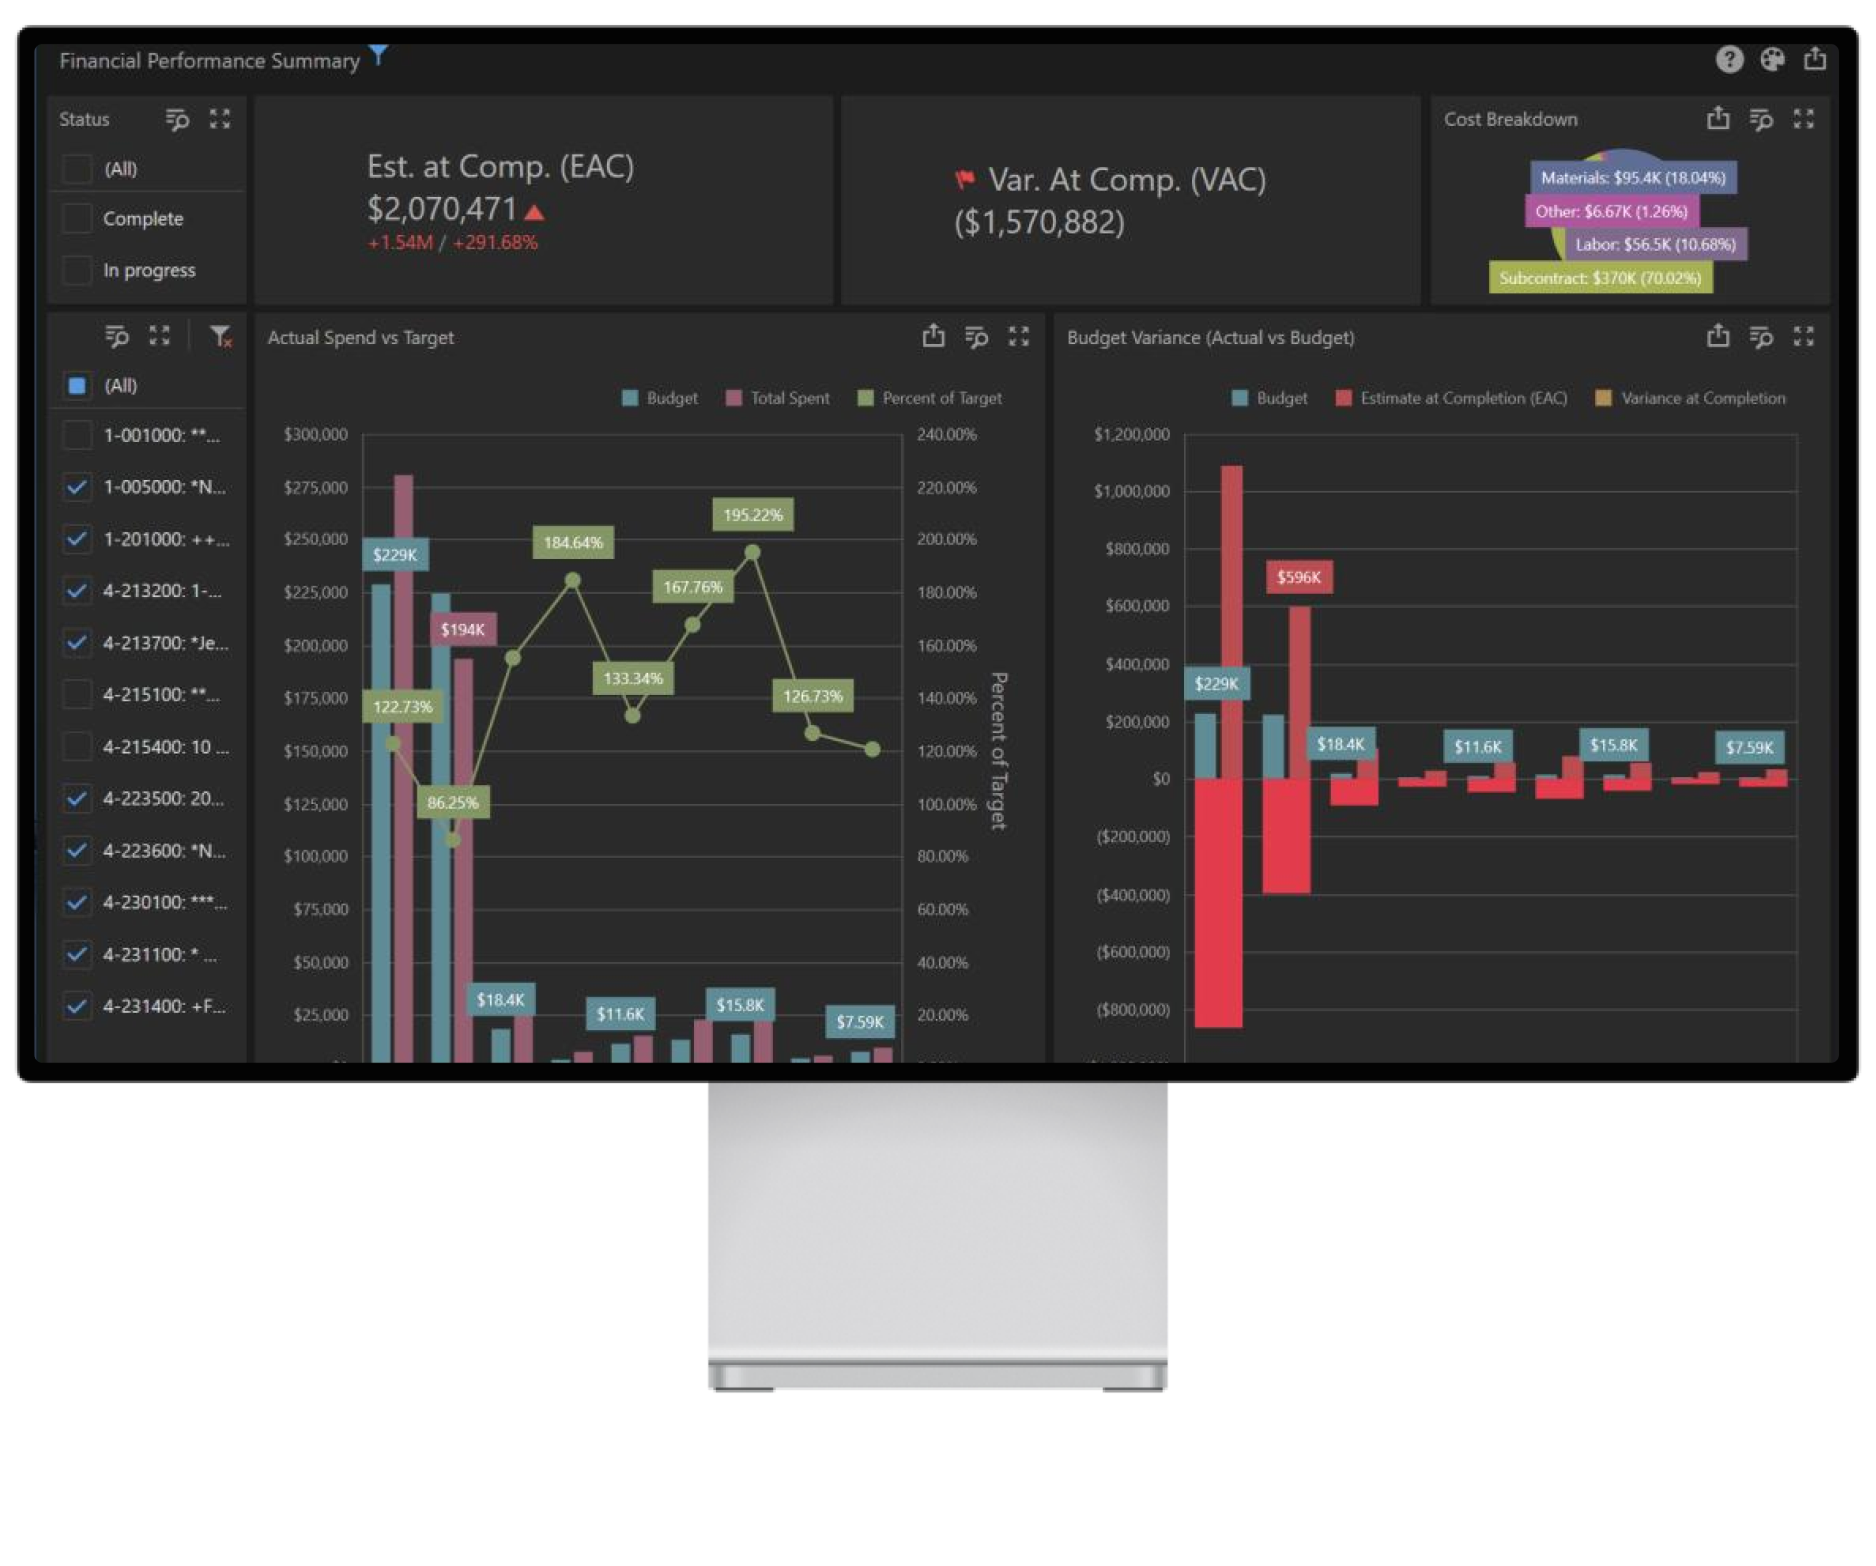
Financial Health & Performance Dashboard - ContractorBI

Who Uses This Dashboard?

  • Executives and project leaders
  • Front-line sales managers
  • Estimators and financial managers
  • Project managers

Key Metrics Provided

  • Budget vs actuals
  • Revenue forecasts using probability and pipeline
  • Estimate to Complete (ETC) and Variance at Completion (VAC)
  • Cash flow forecasting
  • Job profitability and cost performance by market, estimator, or type
Why It Matters

The Financial Health & Performance Dashboard offers real-time insights into revenue forecasts, cash flow, job profitability, and cost performance, eliminating surprises and supporting smarter financial planning.

This addresses pain points like:

  • Cost overruns and lost profit
  • A lack of visibility into outstanding project commitments
  • Challenges forecasting cash flow, cash flow requirements, or revenue
  • Failure to budget and plan financially
  • Manual and time-consuming reporting
This addresses pain points like:

Key Questions Answered

  • Are we financially on track?
  • Where are we at risk of overruns or shortfalls?
  • Which areas of our business (job types, market segments, or sales reps) are underperforming?
4. Predictive Analytics Dashboard

4. Predictive Analytics Dashboard

Use your data and generative AI to predict what’s coming.

Predictive Analytics Dashboard - ContractorBI

Who Uses This Dashboard?

  • Front-line sales managers
  • Sales reps and estimators
  • Marketing teams

Key Metrics Provided

  • Predicted bid win rates
  • Job start/end dates (including delays)
  • Forecasted project profitability

  • Engagement effectiveness (time, content)

Why It Matters

Rather than just showing current data, this dashboard analyzes historical trends and patterns so you can forecast more accurately, optimize marketing efforts, and refine business development strategies. This helps you reduce risk and improve strategic planning over the long term.

This addresses pain points like:

  • Inability to predict sales and revenue
  • No insight into labor demand
  • Difficulty forecasting bid conversion rates or delays
  • Uncertainty about what drives engagement or results
This addresses pain points like:

Key Questions Answered

  • Which stages of the sales pipeline are improving or declining over time?
  • What are the key inflection points where sales and marketing efforts should focus?
  • How does our current sales pipeline compare to previous quarters or years?
  • Are we on track to meet long-term sales goals based on historical trends?
  • Are our forecasts aligned with project and labor needs?
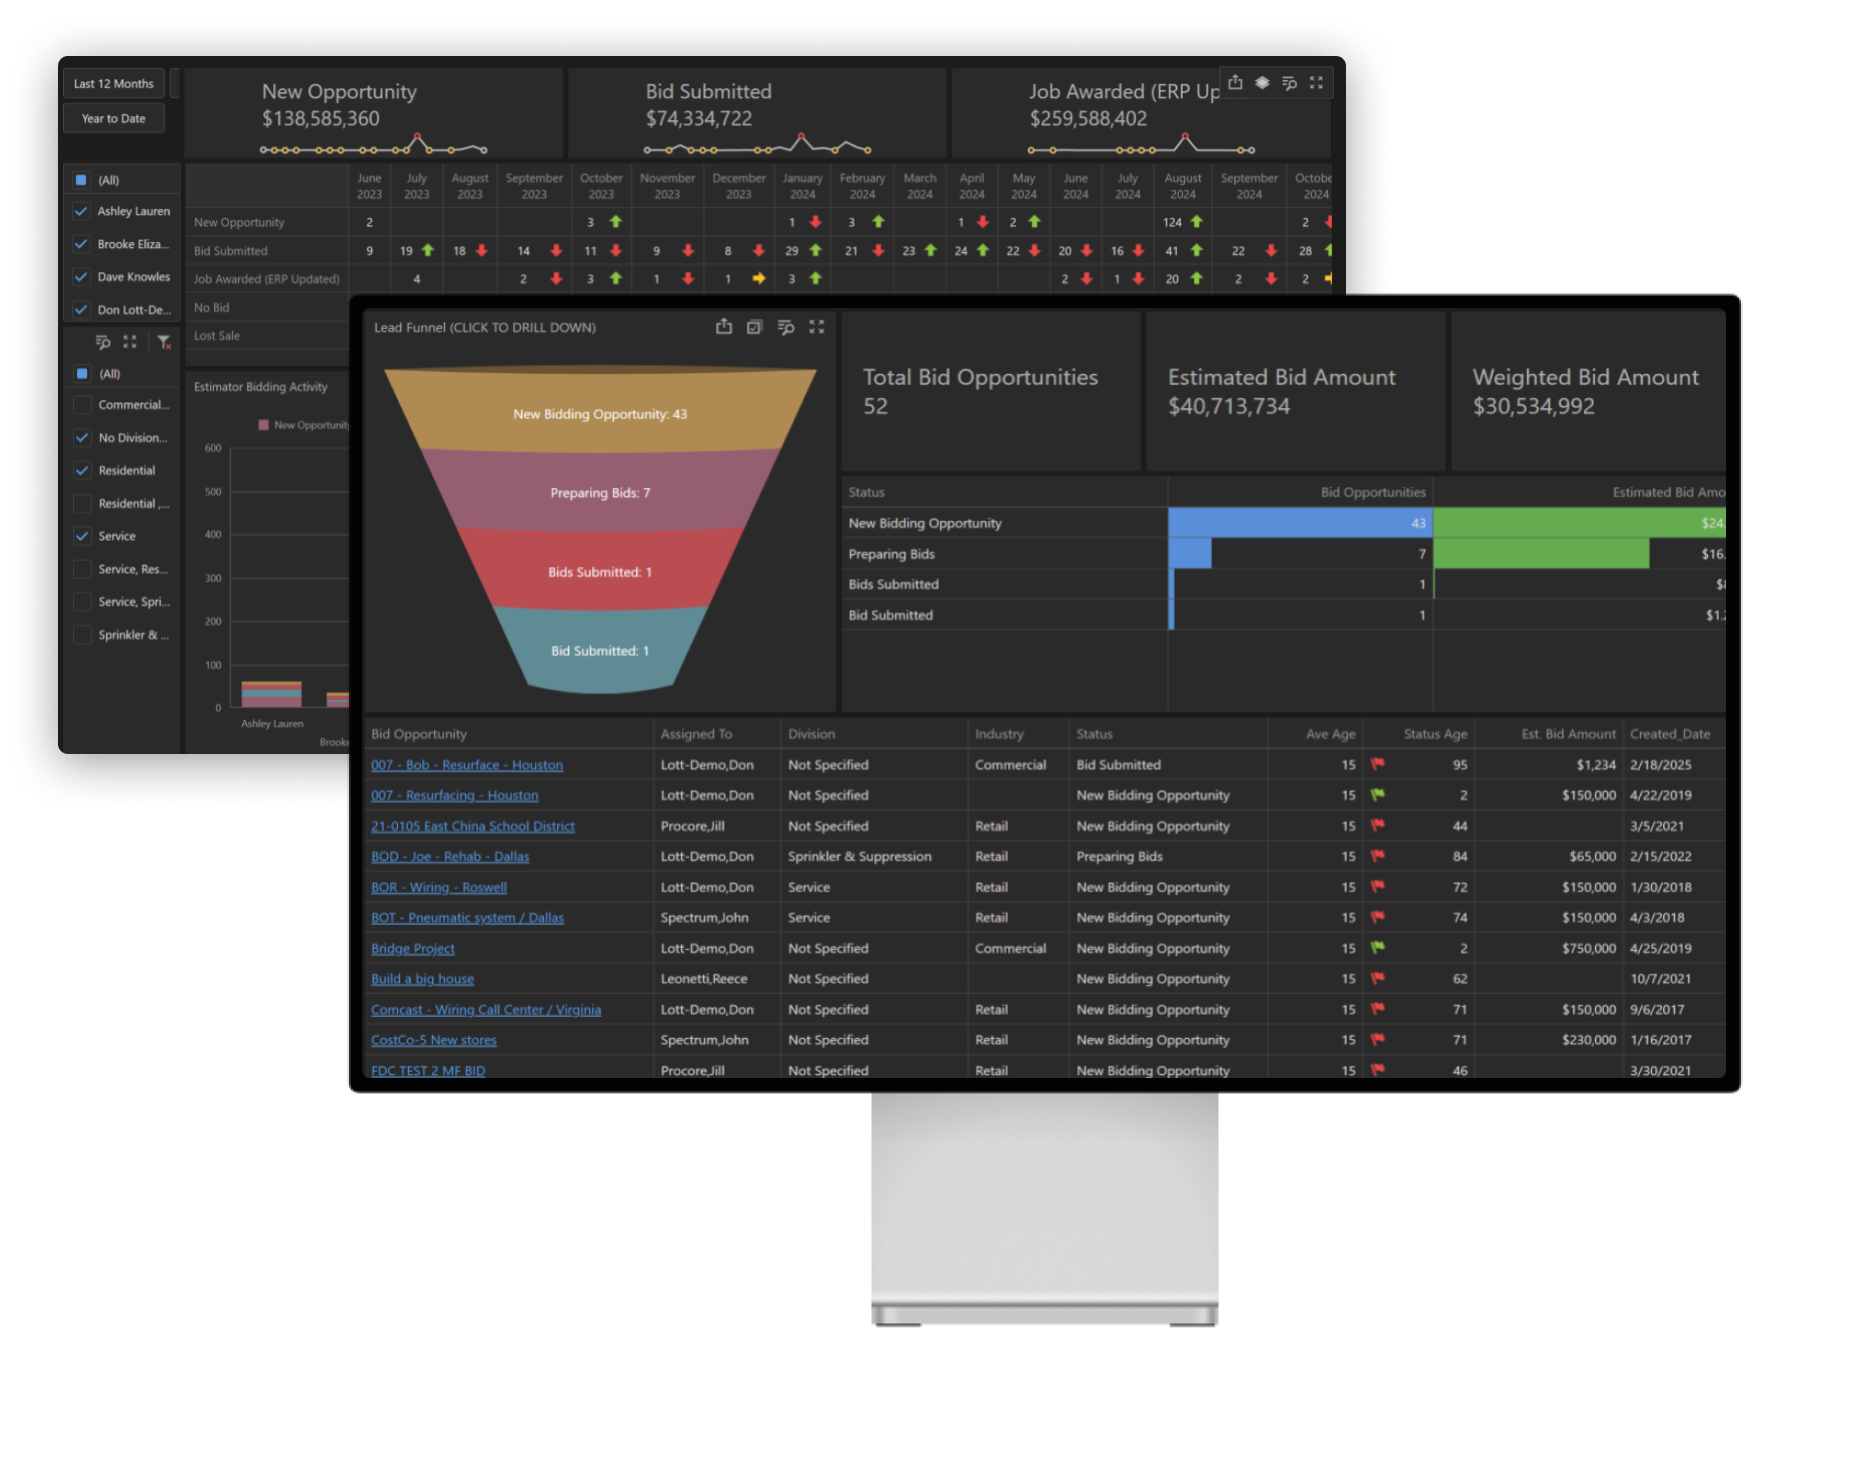
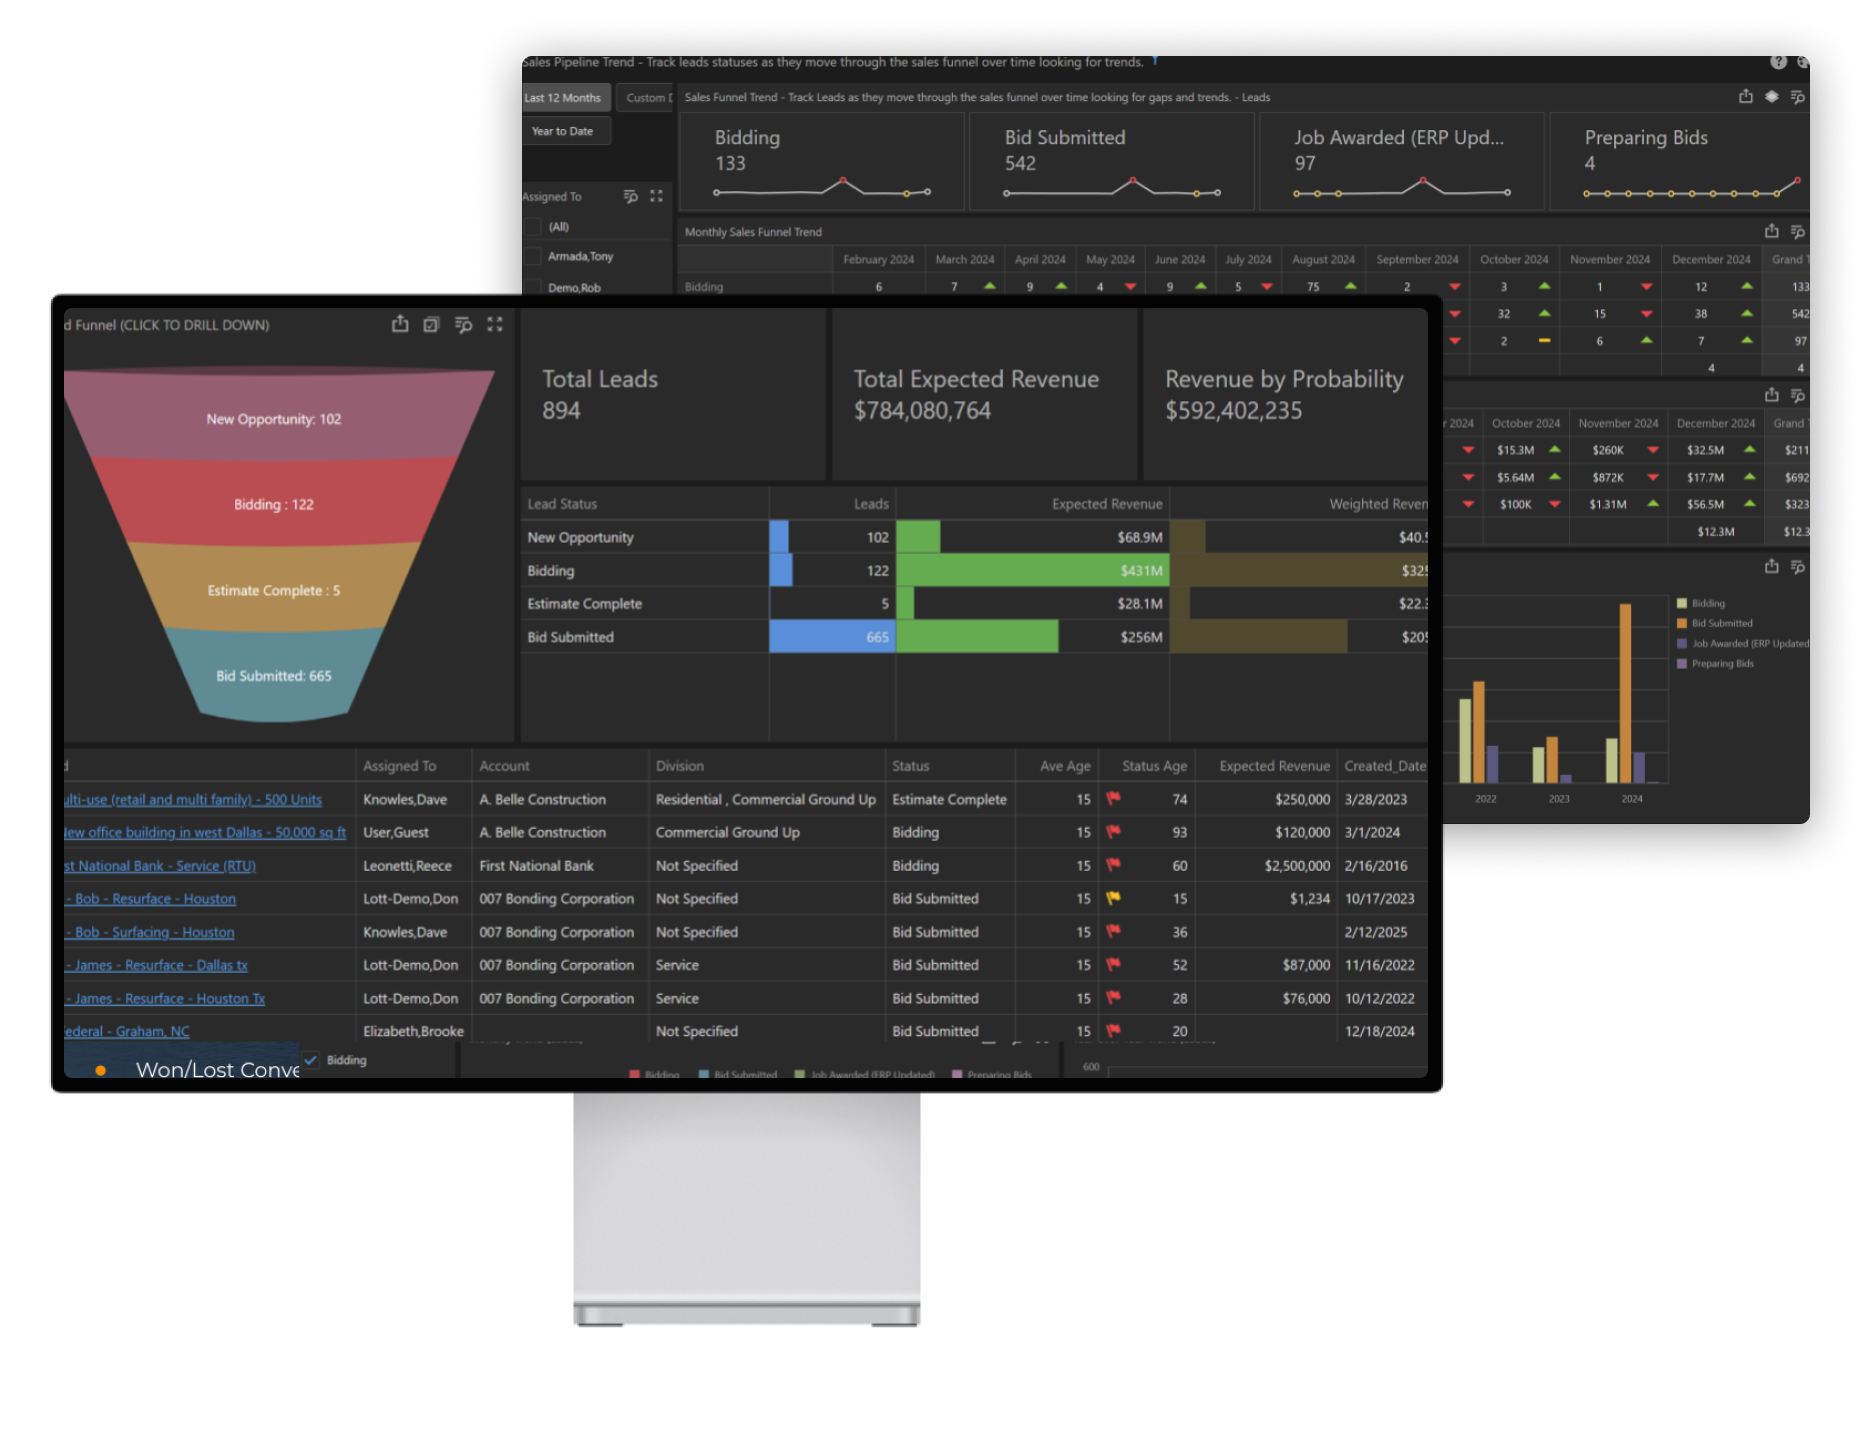
5. Bids and Proposals Dashboard

5. Bids and Proposals Dashboard

A real-time breakdown of bid activity, performance, trends, and win/loss reasons to keep projects on track and maximize margins.

Bids and Proposals Dashboard - ContractorBI

Who Uses This Dashboard?

  • Executives and stakeholders
  • Project administrators
  • Sales managers
  • Estimators and finance teams

Key Metrics Provided

  • Bid activity by job
  • Win/loss performance
  • Proposal conversion rates
  • Lost reason analysis

Why It Matters

Having real-time visibility into the volume and performance of your bidding activity is critical for all types of construction projects. This dashboard helps you prioritize high-probability jobs and improve win rates across multiple projects.

This addresses pain points like:

  • No view of bid volume or trends
  • Inability to track win/loss reasons
  • Missed deadlines
  • No insight into performance by job type or market
This addresses pain points like:

Key Questions Answered

  • Which stages of the sales pipeline are improving or declining over time?
  • What are the key inflection points where sales and marketing efforts should focus?
  • How does our current sales pipeline compare to previous quarters or years?
  • Are we on track to meet long-term sales goals based on historical trends?
  • Are our forecasts aligned with project and labor needs?
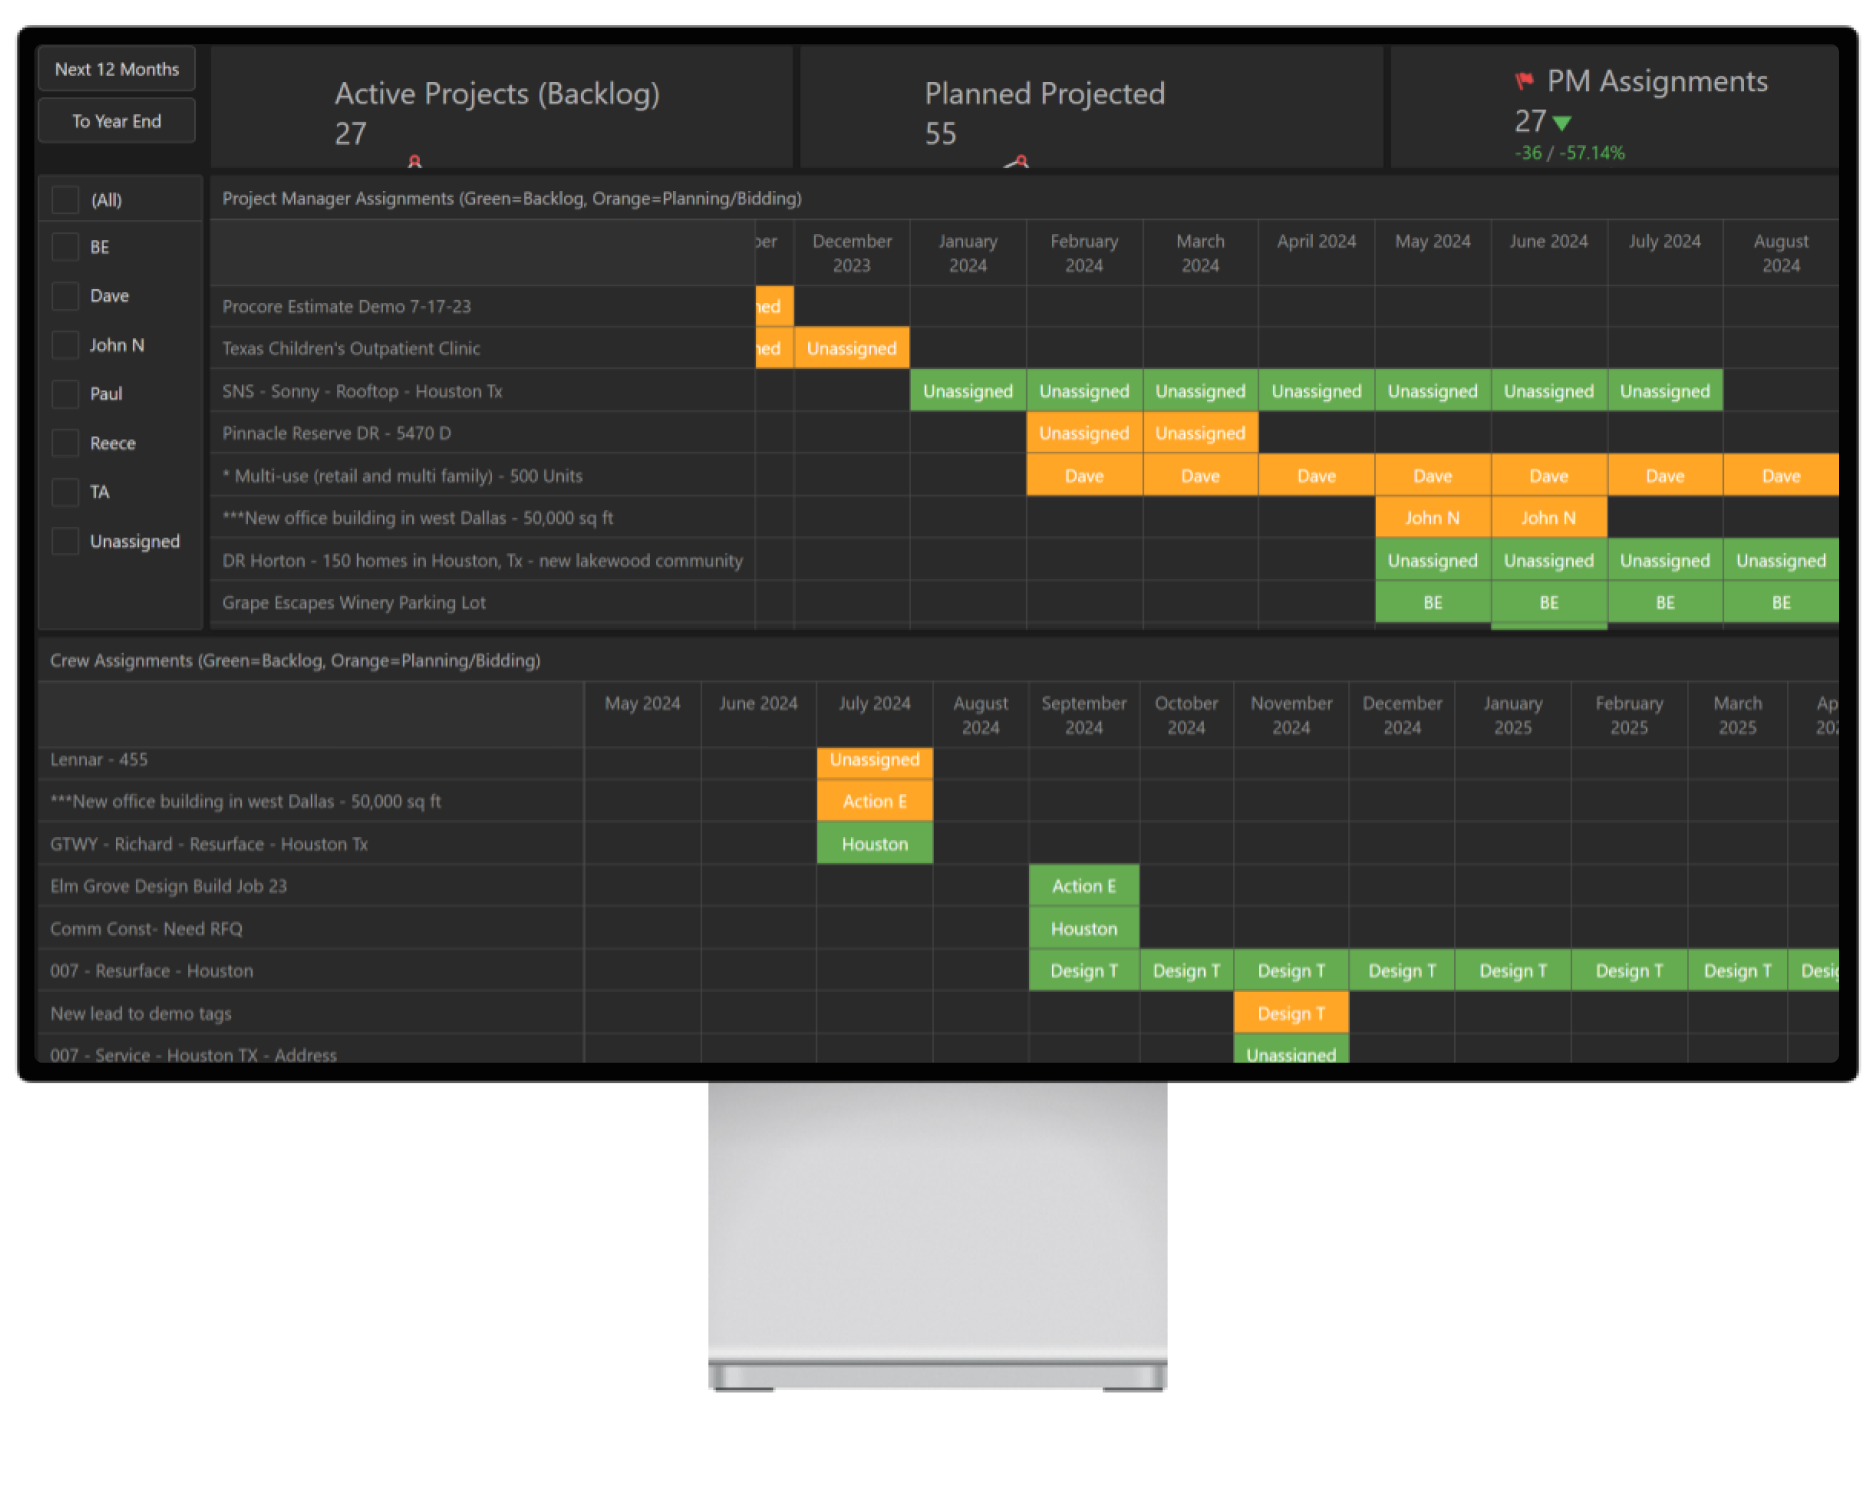
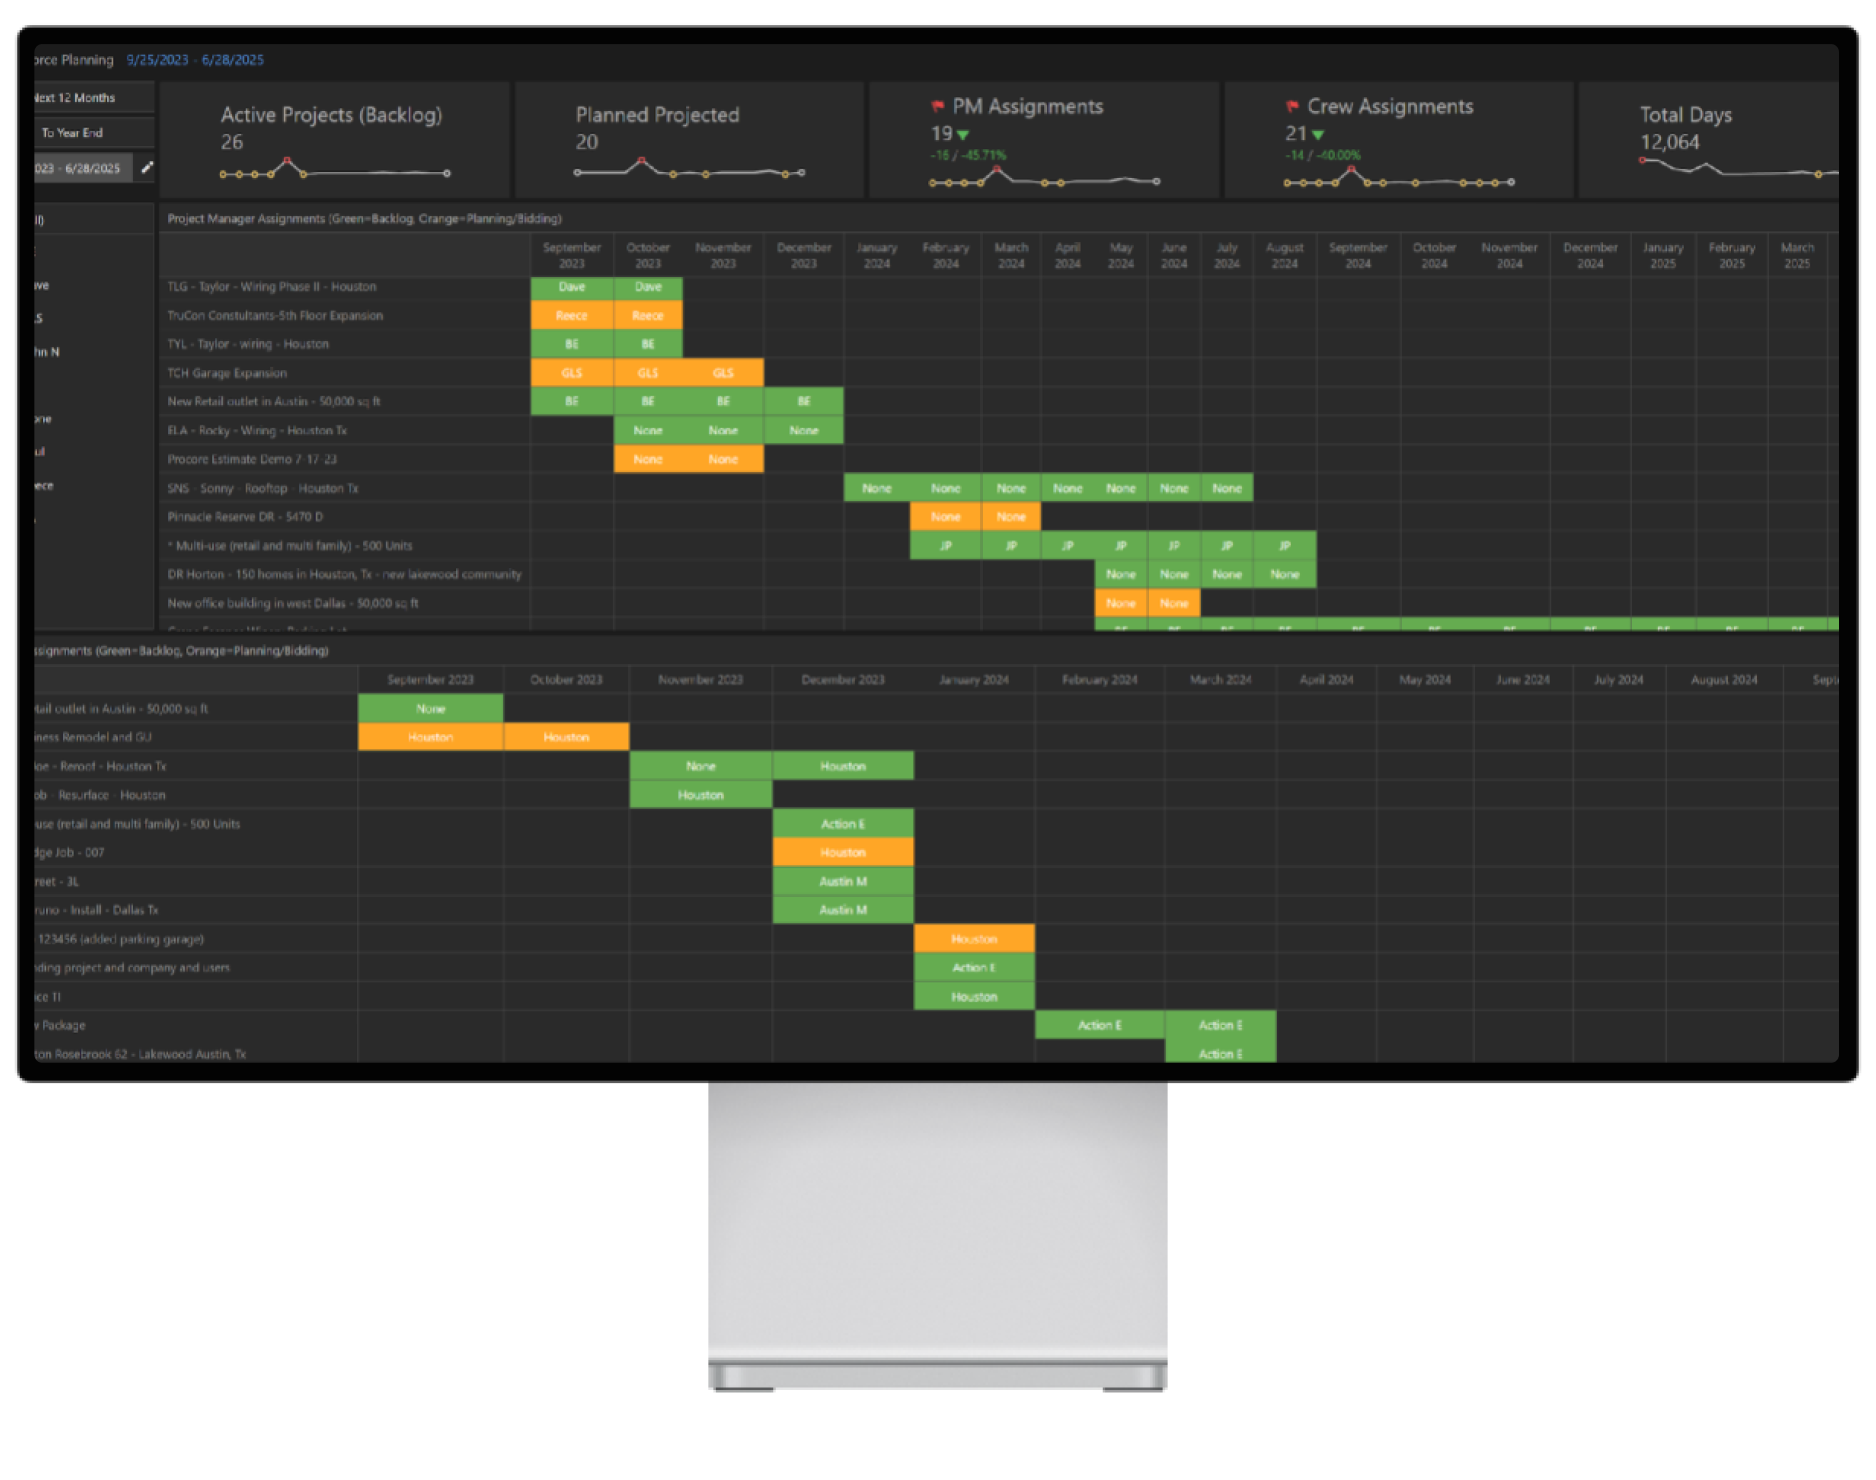
6. Workforce & Job Resource Planning Dashboard

6. Workforce & Job Resource Planning Dashboard

Ensure you have the right labor at the right time.

Workforce & Job Resource Planning Dashboard - ContractorBI

Who Uses This Dashboard?

  • Executives and business owners
  • Scheduling and operations leads
  • HR and staffing teams

Key Metrics Provided

  • Forecast of labor needs
  • Utilization rates
  • Labor availability by skill or role
  • Idle labor trends

Why It Matters

This dashboard helps you forecast labor needs based on project pipeline, project status, start dates, and historical data so you can plan ahead, avoid over/understaffing, and optimize resource allocation.

This addresses pain points like:

  • Labor shortages or idle teams
  • Missed bid opportunities due to lack of resources
  • High costs from subcontractor overuse
  • No visibility into current or future labor needs
This addresses pain points like:

Key Questions Answered

  • Do we have the labor we need for upcoming work?
  • Where are we over- or underutilizing crews?
  • What adjustments should we make to hiring or subcontracting?
7. Sales and Lead Management Dashboard

7. Sales and Lead Management Dashboard

Keep your pipeline full and moving.

Sales and Lead Management Dashboard - ContractorBI

Who Uses This Dashboard?

  • Executives and business owners
  • Financial and operations managers
  • Sales and estimating teams

Key Metrics Provided

  • Sales pipeline and trend analysis
  • Conversion rates and lost reasons
  • Pipeline aging
  • Lead source and engagement performance

Why It Matters

The Sales and Lead Management Dashboard helps you build a stronger pipeline and close more work. It ensures steady work pipelines, preventing unexpected revenue gaps.

This addresses pain points like:

  • Sales stalls or pipeline gaps
  • Poor lead conversion
  • Lack of visibility into marketing effectiveness
  • Inability to track progress against sales goals
This addresses pain points like:

Key Questions Answered

  • Are we on track to meet revenue targets?
  • What’s holding back our conversions?
  • How do upcoming job starts and bid opportunities impact our revenue outlook?
  • Where are potential revenue gaps, and what actions are needed to fill them?
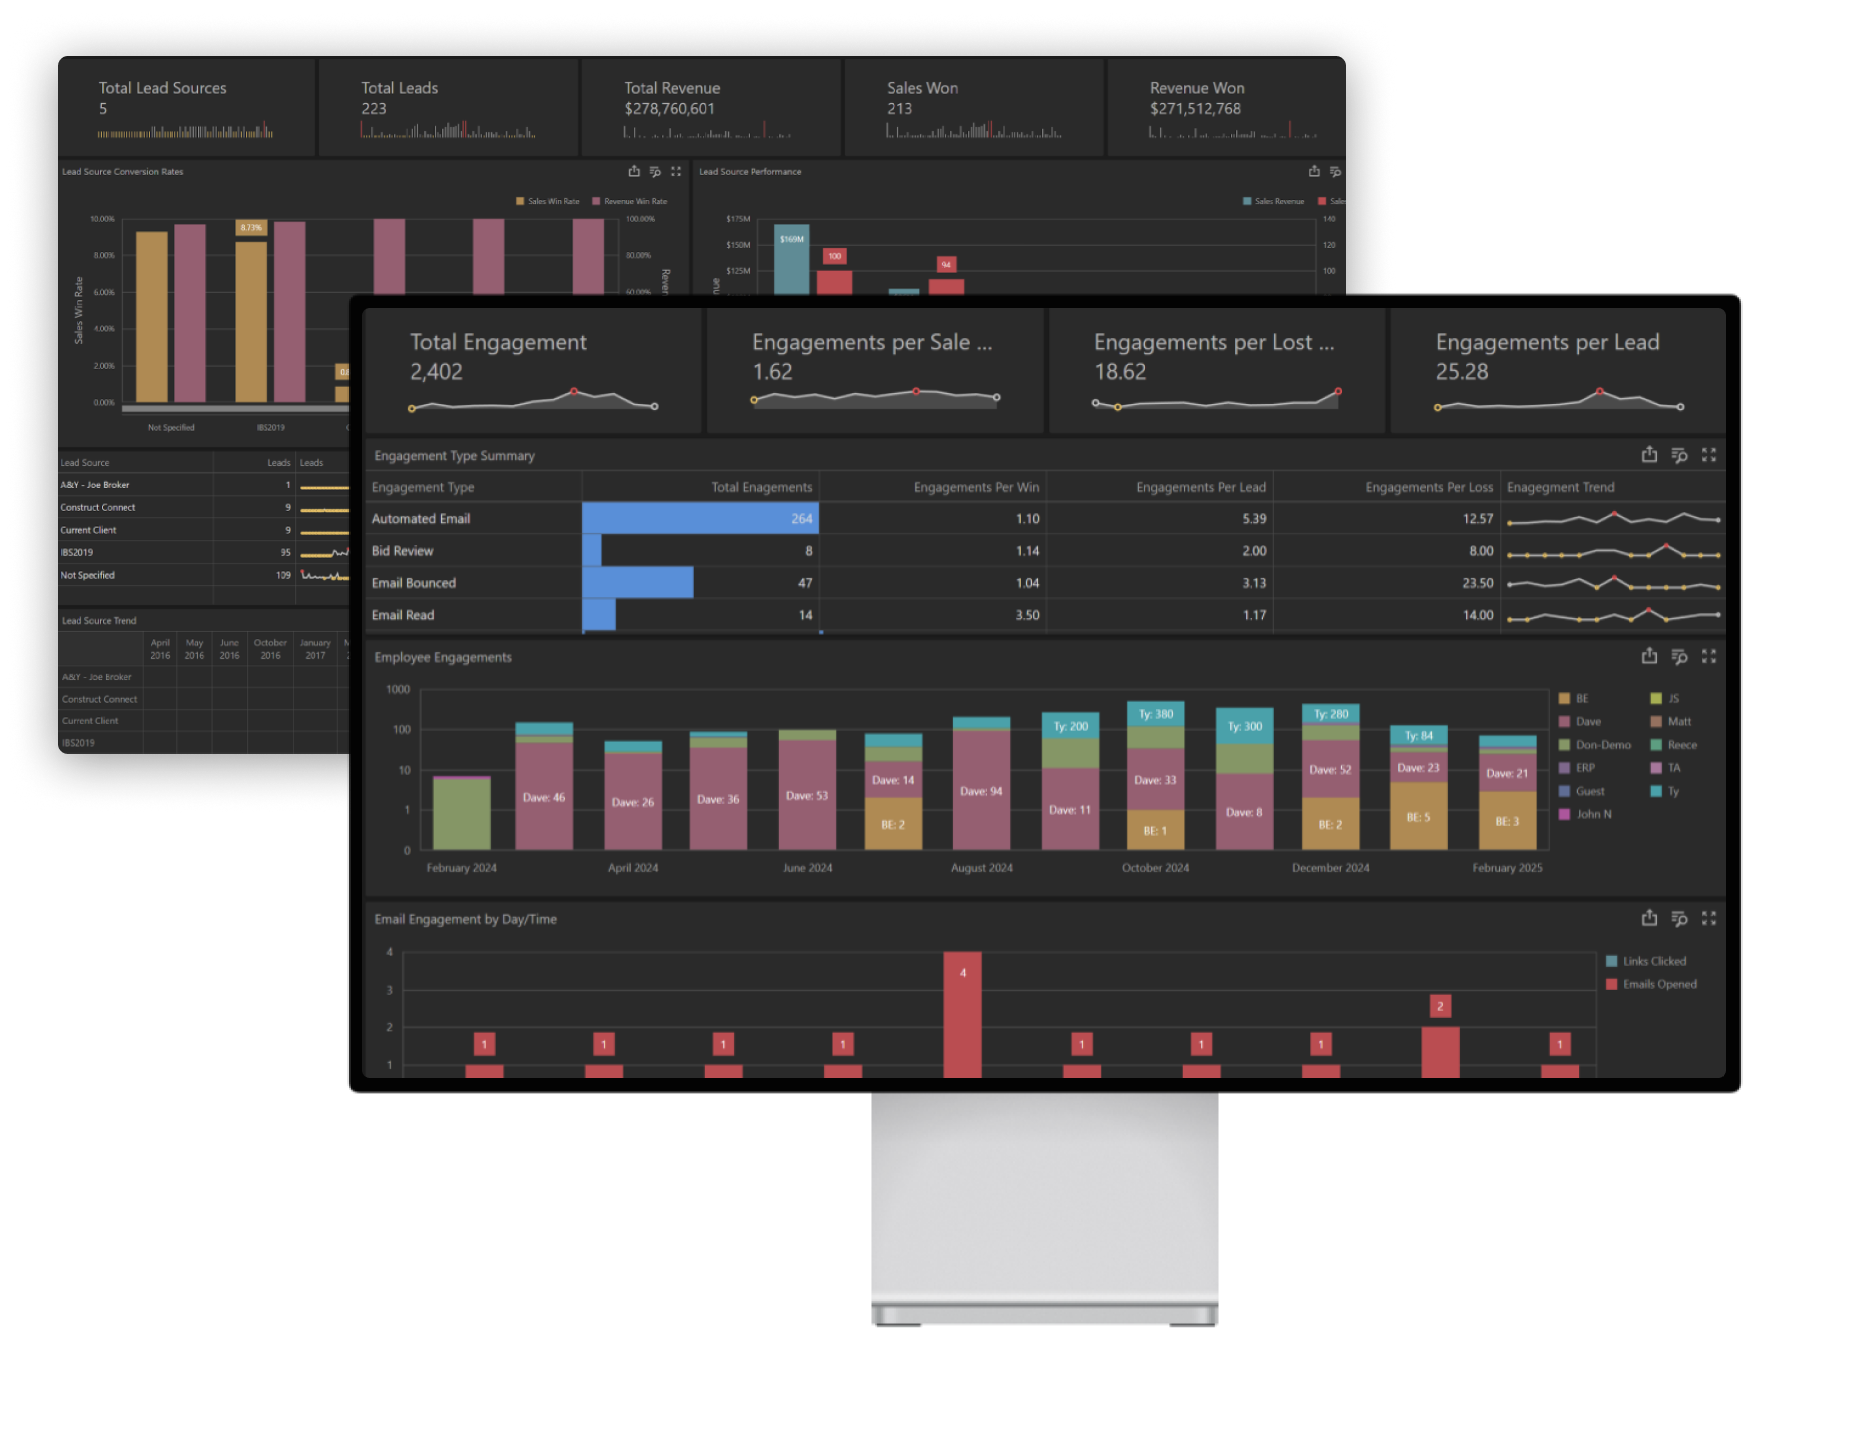
8. Marketing & Business Development Dashboard

8. Marketing & Business Development Dashboard

Track campaign ROI and marketing effectiveness.

Marketing & Business Development Dashboard - ContractorBI

Who Uses This Dashboard?

  • Executives and business owners
  • Marketing teams
  • Sales and business development teams

Key Metrics Provided

  • Engagement summary
  • Lead source performance
  • Campaign ROI
  • Account-based engagement

Why It Matters

This dashboard helps you evaluate which campaigns and sources drive results so you can optimize spend, improve engagement, and generate more qualified leads from different sources.

This addresses pain points like:

  • Lack of visibility into campaign or source performance
  • Wasted ad spend
  • Marketing is not aligned with sales
  • Inability to attribute leads or ROI
This addresses pain points like:

Key Questions Answered

  • What’s working in our marketing?
  • Where are we wasting time or money?
  • How aligned are our sales and marketing strategies?
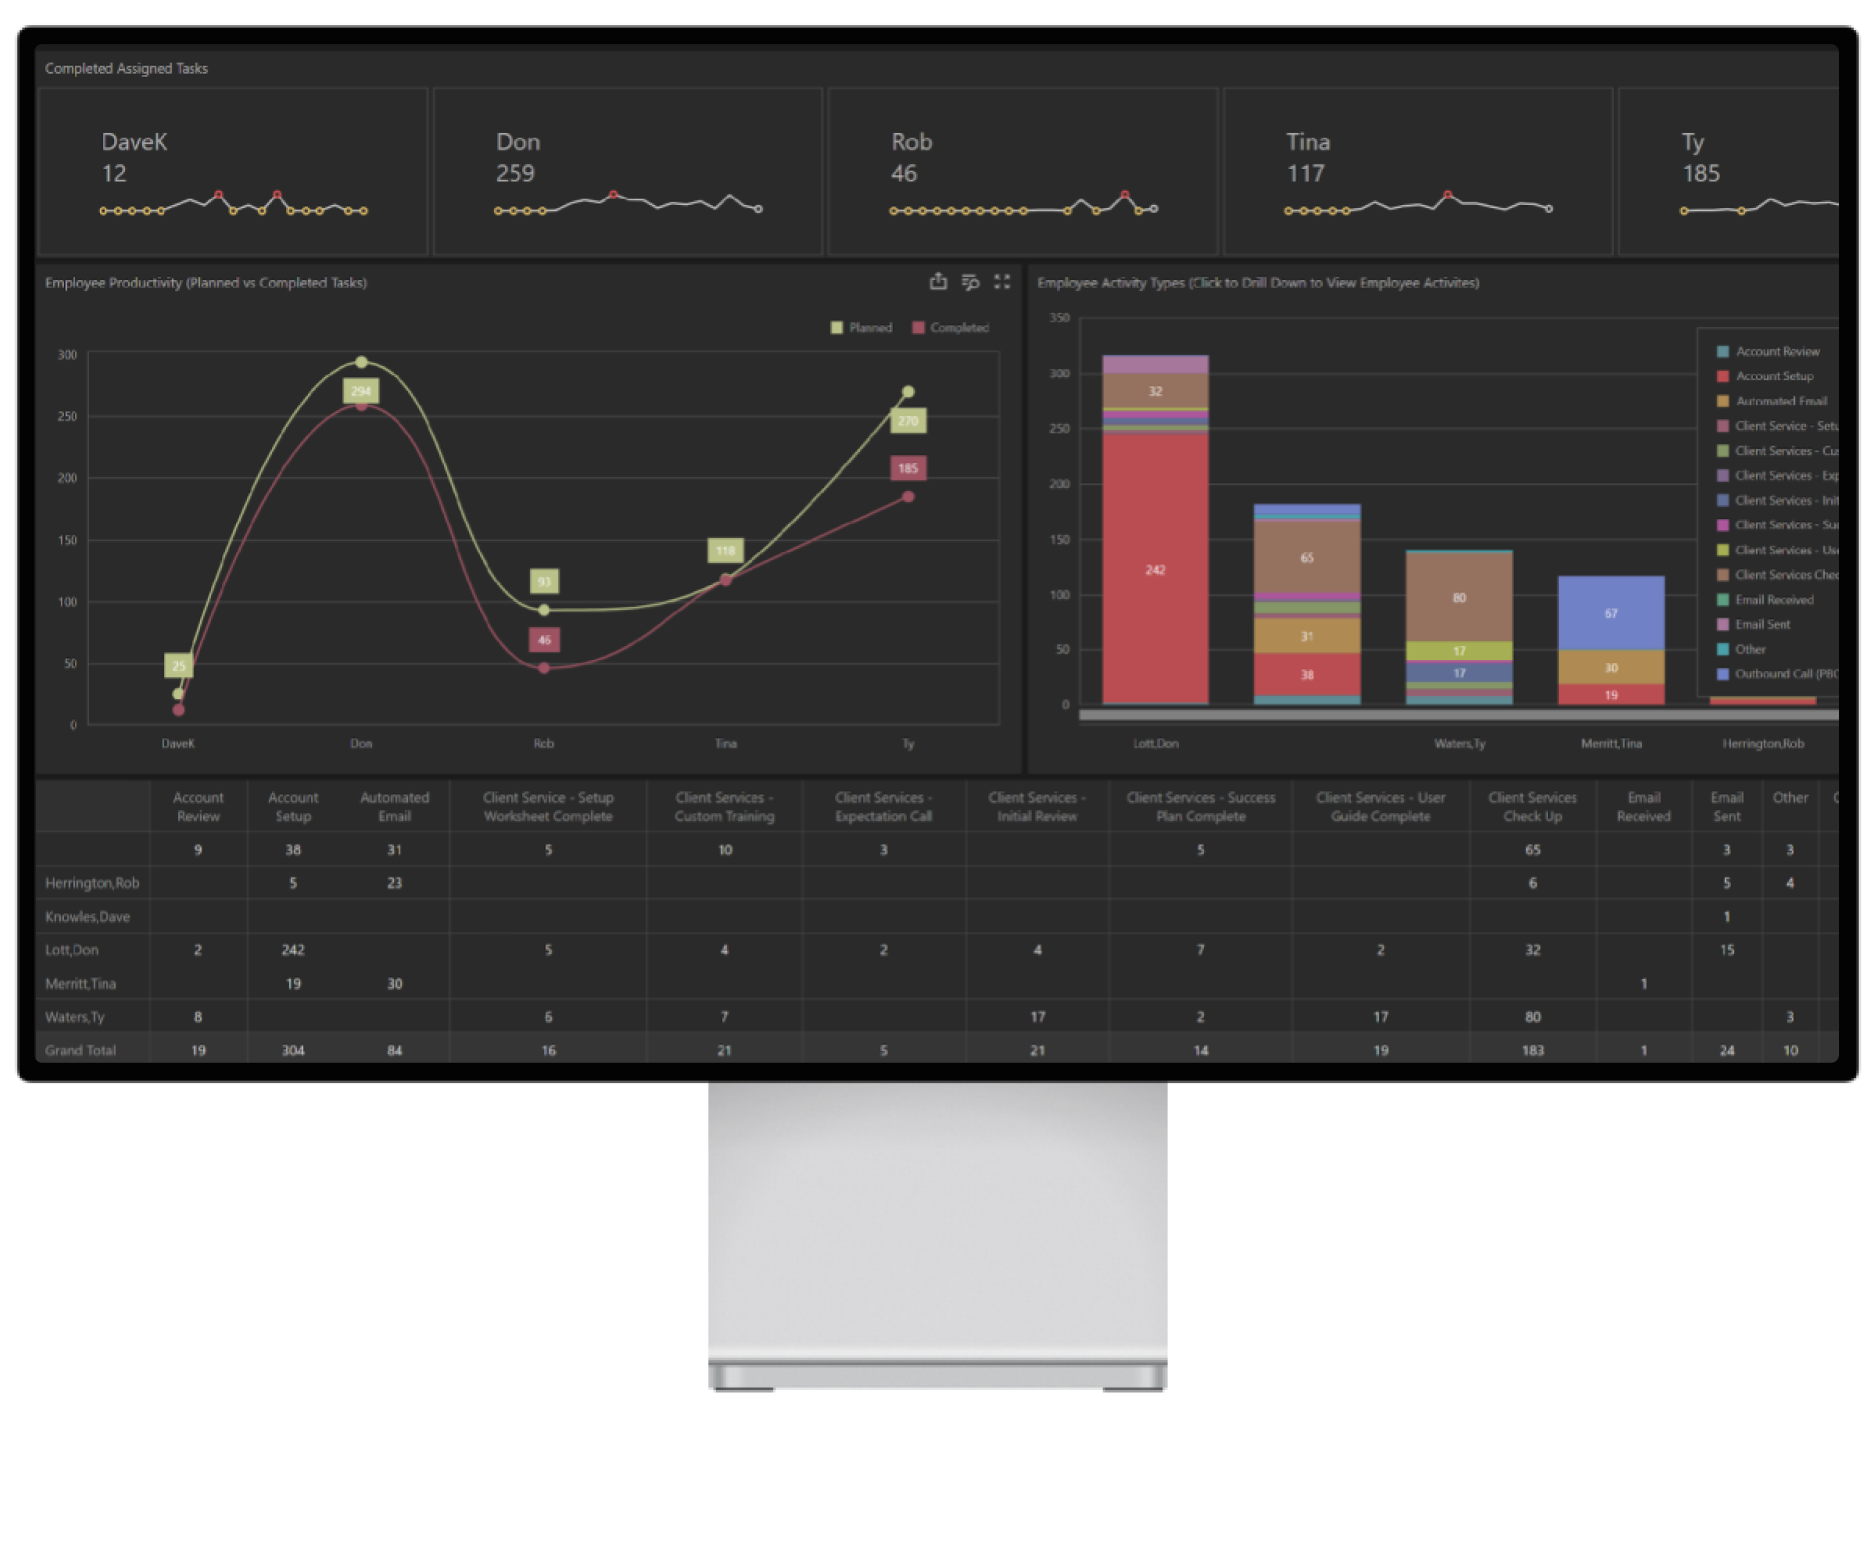
9. Employee Performance Dashboard

9. Employee Performance Dashboard

Boost productivity, recognize top performers, and improve accountability.

Employee Performance Dashboard - ContractorBI

Who Uses This Dashboard?

  • Executives and business owners
  • Project managers
  • HR teams

Key Metrics Provided

  • Task completion (planned vs completed)
  • Activity and usage tracking
  • Employee and crew utilization

Why It Matters

The Employee Performance Dashboard helps you measure task completion, employee engagement, and resource utilization while also encouraging accountability and supporting team development. Significantly enhance communication among your team with this single source of truth.
This addresses pain points like:

  • Low productivity or engagement
  • Lack of visibility into staff performance
  • Inefficient use of internal resources
This addresses pain points like:

Key Questions Answered

  • Are we supporting our people effectively?
  • Who needs recognition?
  • Where can we improve team performance?
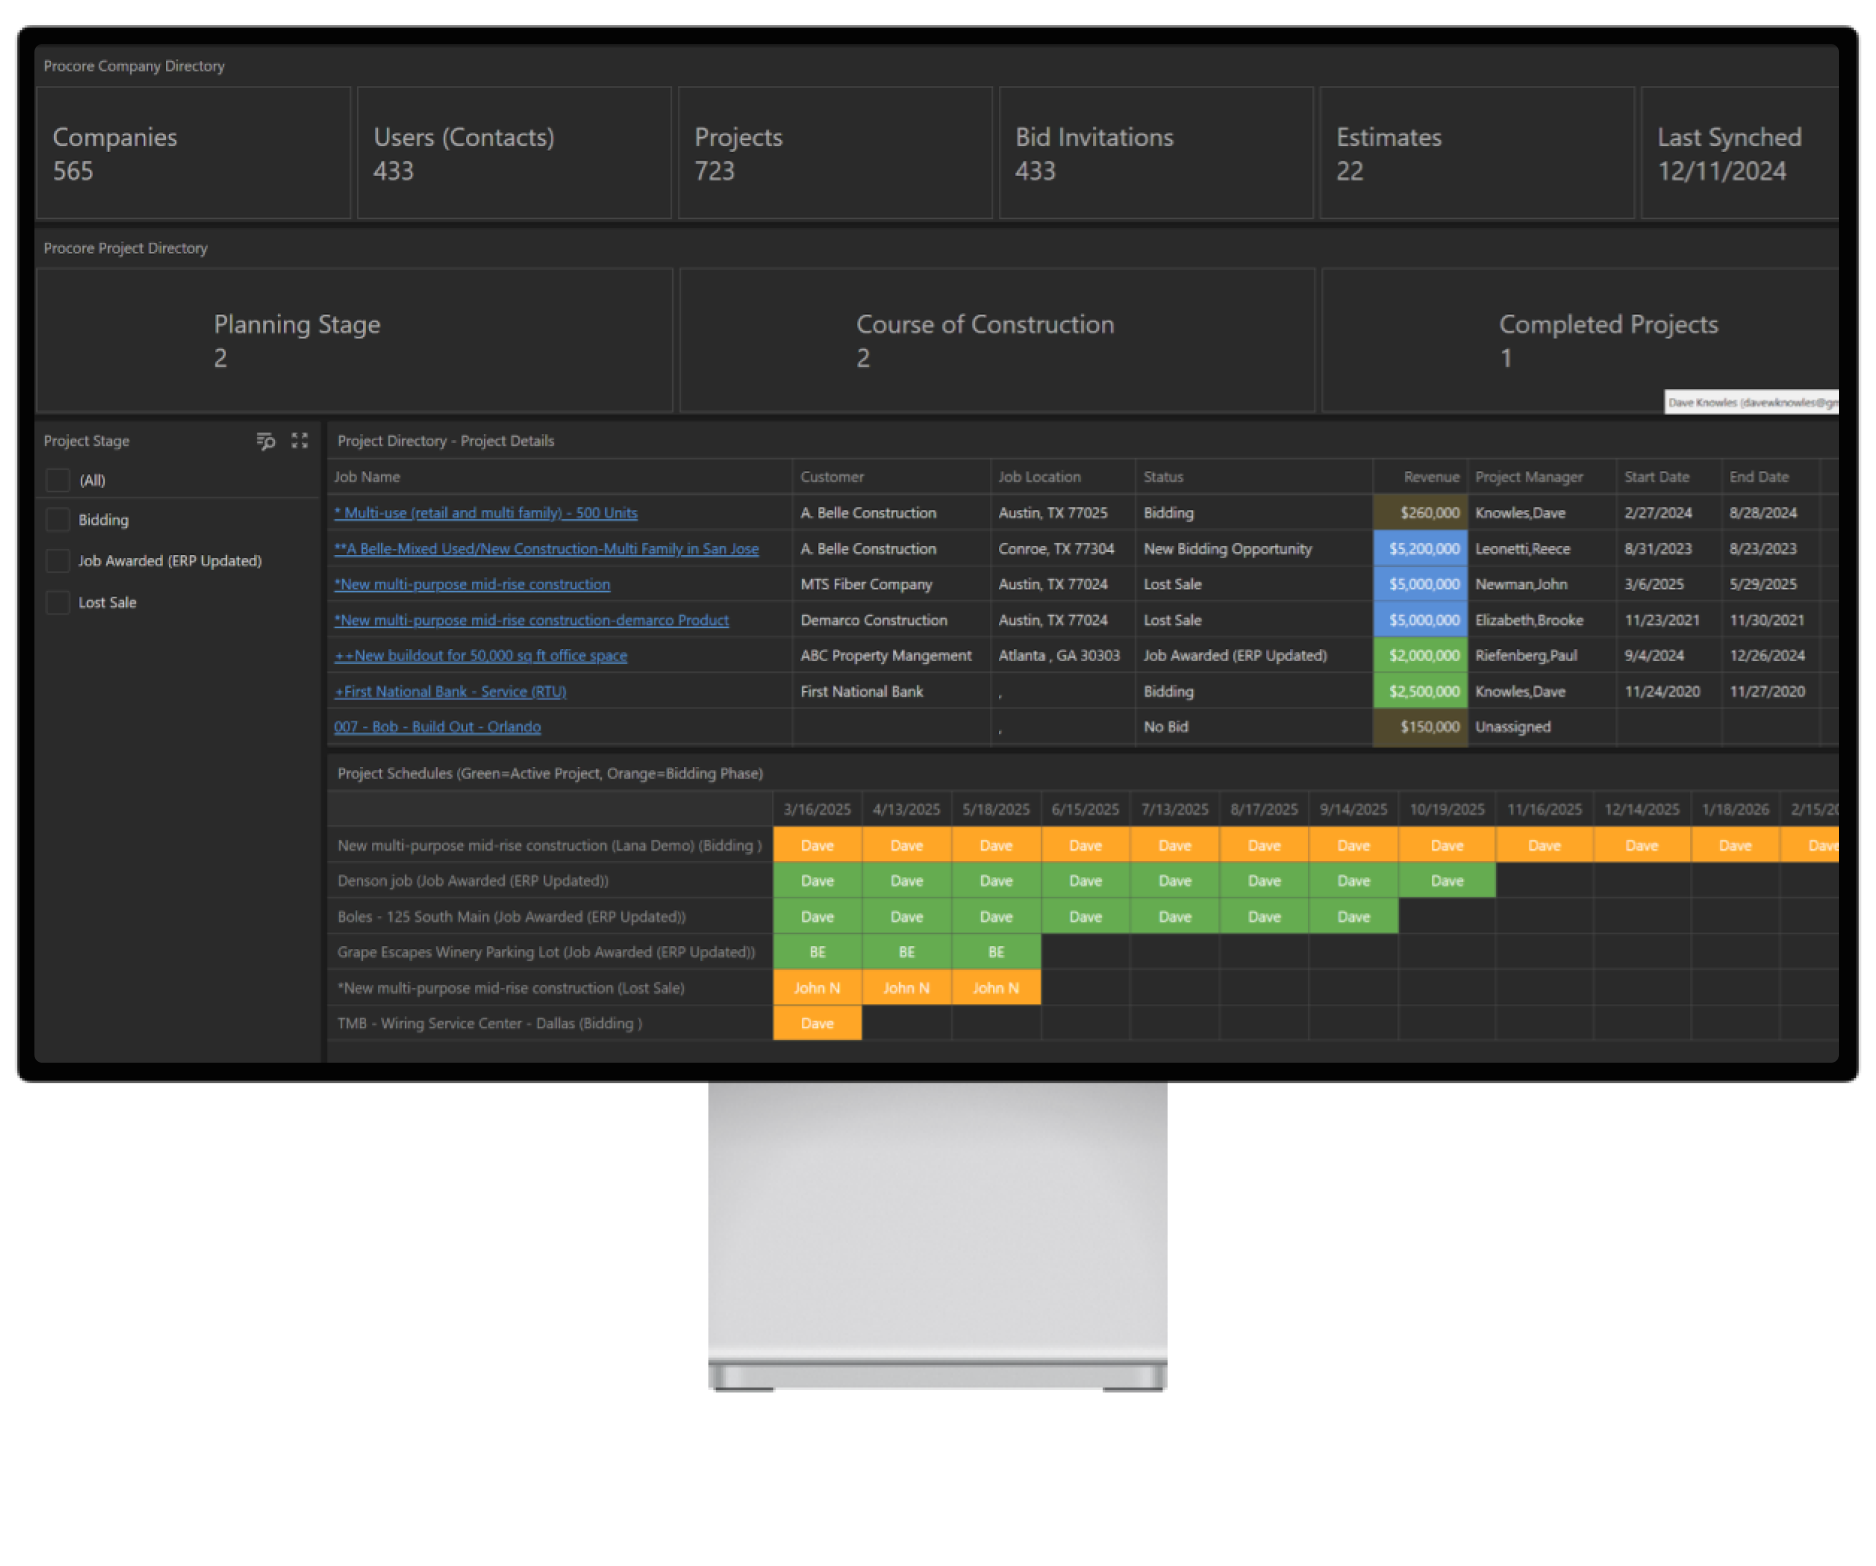
10. Integrations & Data Insights Dashboard

10. Integrations & Data Insights Dashboard

Unify your systems, clean your data, and improve reporting accuracy.

Integrations & Data Insights Dashboard - ContractorBI

Who Uses This Dashboard?

  • Executives and business owners
  • Business development managers and analysts
  • IT admins

Key Metrics Provided

  • Data sync and error alerts
  • System comparison (contacts, jobs, etc.)
  • Aging of data (time since the last updates)
  • API integration status

Why It Matters

This dashboard tracks data sync status, duplication, errors, and inconsistencies across systems, ensuring clean, unified data for better decision-making.

This addresses pain points like:

  • Duplicate or missing data
  • No visibility into integration issues
  • Inconsistent reporting between systems
This addresses pain points like:

Key Questions Answered

  • Is our data clean and consistent across platforms?
  • Are integrations running smoothly?
  • Where are there gaps, errors, or outdated records?

Make Your Data Actionable and Take Control of Your Growth

construction worker

FAQ: Construction Dashboards

What is a construction dashboard?

A construction dashboard is a centralized, real-time visual interface that aggregates key performance indicators (KPIs) across project cost, schedule, safety, and business development into a single, actionable view. Unlike static spreadsheets or monthly reports, a construction dashboard pulls live data from your ERP, project management tools, estimating platform, and CRM — giving project managers, executives, and field teams an instant read on project health without manually compiling information. The most effective dashboards go beyond job site data to include pre-construction pipeline metrics like bid win rate and pipeline value, giving contractors a complete picture of both current performance and future revenue.

What KPIs should be on a construction project dashboard?

The most important KPIs for a construction project dashboard fall into four categories. Financial KPIs include budget variance, cost-to-complete, job margin Gain/Fade, and labor rate variance. Schedule KPIs include planned vs. actual progress percentage, milestone completion rate, and days behind schedule. Safety KPIs include total recordable incident rate (TRIR), days without incident, and near-miss reports filed — with best-in-class TRIR benchmarked below 0.6 per 10,000 labor hours. Sales pipeline KPIs — often missing from generic project dashboards — include bid-to-award ratio, win rate by project type, weighted pipeline value, and average bid cycle time. Contractors who track all four categories make faster, more profitable decisions across the full project lifecycle.

What should be included in a construction dashboard?

An effective construction dashboard should include financial metrics (budget vs. actuals, job cost forecasting), schedule data (planned vs. actual progress, milestone tracking), resource allocation (crew deployment, equipment utilization), safety performance (incident rates, audit completion), and role-based views for executives, project managers, and field teams. The most powerful dashboards also include pre-construction pipeline data — active bids by stage, win rate, and revenue forecast — that generic project management tools typically leave out. Drill-down capability (from portfolio level to individual line items), automated alerts for cost overruns or schedule slippage, and direct integration with your ERP and CRM round out a complete construction dashboard.

How do I create a construction dashboard?

Setting up an effective construction dashboard follows six steps. First, define the 3–5 decisions the dashboard needs to support — clarity on purpose prevents metric overload. Second, audit and connect all data sources: ERP, estimating platform, project management software, and CRM. Third, select role-specific KPIs so executives, project managers, estimators, and CFOs each see only what drives their decisions. Fourth, build role-based views with drill-down capability from portfolio to project to task level. Fifth, configure automated alerts for key thresholds such as cost variance exceeding 5% or overdue RFIs past a set number of days. Sixth, establish a review cadence — daily for project dashboards, weekly for executive views, and real-time for bid pipeline tracking. The fastest path to a working dashboard is using construction-specific BI software with pre-built contractor KPI templates rather than building from scratch in Excel.

What is the best construction dashboard software for contractors?

The right construction dashboard software depends on fit with your existing systems and workflows, but the criteria that matter most are: direct ERP and CRM integration (without manual CSV exports), pre-built construction KPI templates for project health and bid pipeline tracking, role-based access so each user sees their relevant data, drill-down from portfolio level to individual job details, and mobile access for field teams. Generic BI tools like Power BI or Tableau can work but require months of custom configuration for construction-specific workflows. Purpose-built contractor BI platforms like ContractorBI come pre-loaded with the metrics and integrations that matter to specialty contractors, general contractors, and construction CFOs — without the heavy setup overhead.

How does a construction dashboard improve project management?

A construction dashboard improves project management by converting raw project data into leading indicators that allow teams to act before problems compound. Real-time dashboards can help reduce cost overruns and improve on-time delivery by surfacing issues earlier, while automated reporting commonly reduces manual reporting effort. Practically, dashboards surface budget variance early, flag rising RFI backlogs that predict schedule slippage, and give executives a portfolio-level view of which jobs are on track and which need intervention. The additional advantage of connecting pre-construction pipeline data to post-award performance is that contractors can identify which project types, clients, and bid strategies consistently deliver healthy margins — closing the loop between winning work and delivering it profitably.

What is the difference between a construction dashboard and a construction report?

A construction dashboard is a real-time, interactive, role-based display that updates continuously from live data sources — it shows what is happening right now and alerts users when thresholds are crossed. A construction report is a static, periodic document (typically weekly or monthly) that summarizes what has already happened, compiled manually or generated on a schedule. Dashboards support proactive decision-making; reports support documentation and accountability. The practical difference: a dashboard tells you a cost overrun is developing today so you can act; a report tells you the overrun already happened last month. High-performing construction teams use dashboards for daily operational management and reports for stakeholder communication and historical record-keeping.

What are the different types of construction dashboards?

There are six primary types of construction dashboards, each serving a different role and decision set. A project performance dashboard tracks schedule adherence, milestone completion, and planned vs. actual progress for project managers and superintendents. A financial and job cost dashboard monitors budget variance, labor rate, and margin Gain/Fade for CFOs and controllers. An executive portfolio dashboard provides a high-level health view across all active projects for owners and leadership. A sales pipeline and bid dashboard tracks bid-to-award ratio, win rate, and weighted revenue forecast for estimating teams and business development — a capability most project management tools omit entirely. A safety dashboard monitors incident rates and compliance metrics. A resource allocation dashboard shows crew deployment, equipment utilization, and subcontractor workload across jobs.

Why are most construction dashboards missing bid pipeline data?

Most construction dashboards were designed by project management software companies, not by companies that understand the full contractor business lifecycle. Their focus is on what happens after a project is awarded — schedule, budget, resources, and safety. The pre-construction phase — bidding, estimating, proposal conversion, and pipeline forecasting — is typically tracked separately in a CRM or spreadsheet, if it’s tracked at all. This creates a visibility gap: contractors can see how their active jobs are performing but have no real-time view of the revenue coming next or which types of work they win most profitably. ContractorBI closes this gap by unifying ERP data, project performance data, and CRM/bid pipeline data in a single business intelligence dashboard built specifically for contractors.