The Power of Data Analytics for Construction Businesses: Introducing ContractorBI
Winning bids doesn’t always equal profit. In construction, the difference between a good project and a great one is often hidden in the data. Discover how data analytics can empower your team with smarter decision making before bad data drains your bottom line.


Table of Contents
At first, it might seem like you don’t need data analytics in a field like construction. If you can win bids, you get projects, which means your business grows and you make money. Occasionally, it’s that simple.
Most of the time, though, it’s not just about winning bids and getting projects. It’s about getting the right projects that will be profitable.
Data analytics for construction lets you spot when your estimates are off, see when certain types of clients hurt your bottom line, and ensure that everyone in your company has the information they need to make the best decisions.
In 2020, bad data cost the construction industry $1.8 trillion. To keep your company from being part of a statistic like that, you must start by looking at how your data is managed.
The Problem With Disconnected Data
Let’s assume you have competent people who record the data you need to manage projects. Even with great data, you’ll run into some major problems.
First, there’s the office vs. field work data gap. Without a seamless communication system, on-site managers may use inconsistent reporting standards, leaving office personnel unable to gain important insights.
Then there’s manual data entry. The more people you have typing in data (or worse, taking notes on paper), the more likely you are to have a typo or bad handwriting cost you a lot of money.
Disconnected data also means you don’t have real-time visibility on a project; you’re stuck waiting for reports to roll in so you can sort through them. This leads to poor cash flow forecasting because you don’t know what’s happening on all your worksites at a given time.
Let’s say you’re midway through a commercial renovation on a larger scale than what you’ve worked on in the past. You think you’re at risk of going over budget and are behind schedule, so you decide to pass on a bid for a similar project. But, as it turns out, it’s going well, and you would have had the workers available if you’d won the bid on the new project. Siloed data costs you.
So, how do you collect all the data you need and process it to make the best, most informed decisions going forward? The answer is TopBuilder ContractorBI™.
What Is ContractorBI?
ContractorBI™ (business intelligence) is construction analytics software built specifically for contractors. It allows you to consolidate project, financial, labor, and equipment data so you can easily see the big picture for your project.
Integration with other software — Spectrum, Intacct, or Sage — helps you manage ongoing project schedules, financials, and team details in ContractorBI™. You can view key projects, customers, work orders, and more.
The software displays data in dashboards, which are information hubs that track change in real time based on a particular aspect of your company. For example, the sales and revenue dashboard displays your sales funnel to highlight bottlenecks, tracks progress toward sales goals with visual graphs to support accurate forecasting, and analyzes key sales trends and KPIs.
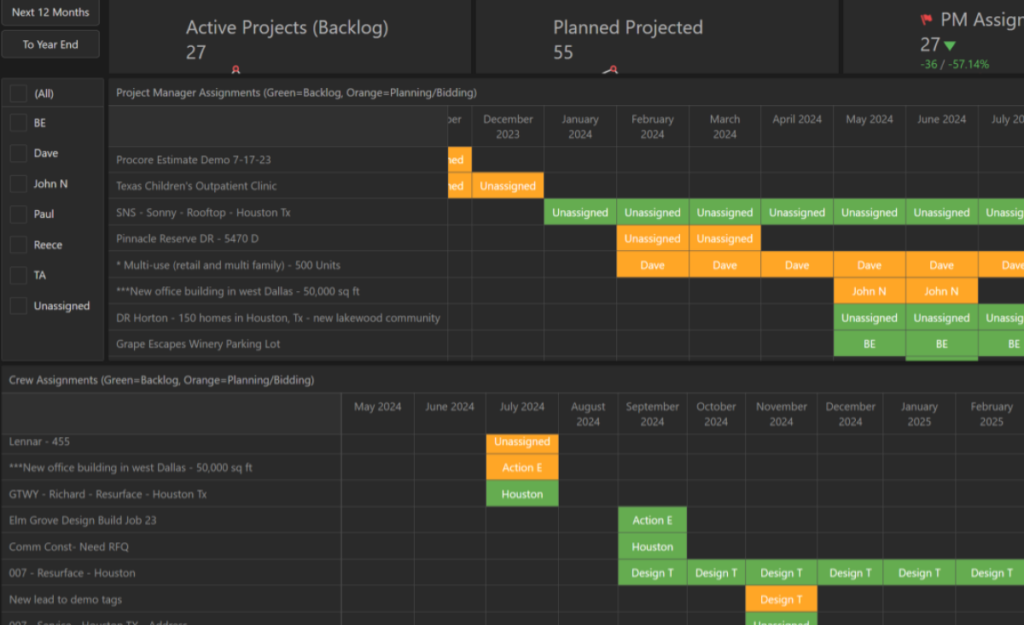
Other dashboards include bid management, workforce and job resources, and marketing. These dashboards have useful features like bid performance trends and won/lost analysis, lead progression, and data on workforce utilization to help you optimize productivity.
Features like these give you the tools you need to track metrics in every aspect of your company. Some data may be more relevant than others, depending on what kind of company you’re running, but for the most part, there are a few top metrics that any contractor should track if you want to stay in the black.
Top Metrics Contractors Should Track

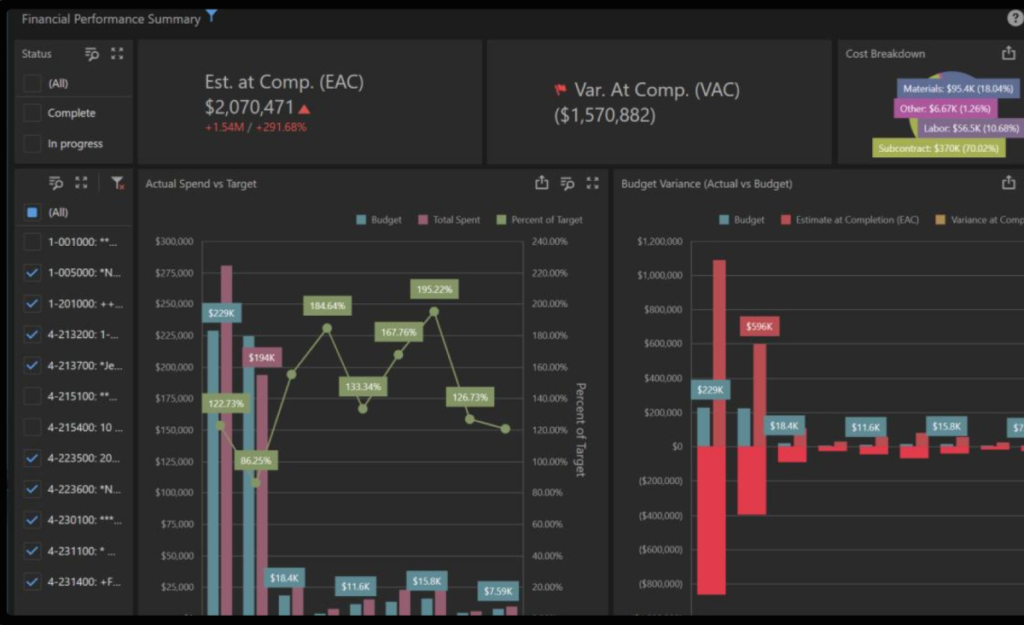
Before you start making specific adjustments to how you run your company, you need a clear picture of how things are going. That’s what makes the metrics on the executive insight dashboard so important. Built for anyone in senior leadership, it provides weekly executive scorecards, KPI tracking, and a financial performance summary. You can track sales, bidding, and revenue trends in real time so you can pivot your strategies.
With leadership aligned, predictive analytics dashboards empower sales managers and reps to spot historical trends and build more accurate forecasts. By delivering insights like bid win rates, project timelines, forecasted profitability, and engagement performance, these dashboards reveal labor demands and market shifts. Using this data, teams can fine-tune marketing efforts and sharpen business development strategies.

Metrics like sales pipeline trend analysis, conversion rates, lost reasons, pipeline aging, and lead source and engagement performance information make the sales and lead management dashboard indispensable. Executives, financial managers, and sales estimating teams need this data to build a stronger pipeline and close more work.
To learn more about other relevant and important metrics and dashboards in the ContractorBI™ system, check out our guide, 10 Core Construction Dashboards That Impact Growth and Profitability.

Related Content

Project Bidding Made Easy for Electrical Contractors

Stop Wasting Time Chasing Dead Ends: Simplify Construction Bidding