A service-oriented specialty contractor runs a different business than a project-based one. Instead of three or four large jobs in motion, you’ve got 50 work orders moving at once. Crews are dispatched, not deployed, and their travel time eats into the day. A job that should take four hours might take six, and you won’t know it lost money until payroll posts two weeks later.
Preparing custom construction reports for stakeholders, owners, investors, and management can feel like a never-ending challenge. Pulling these reports together often means juggling project data from multiple systems, wrestling with manual data entry in spreadsheets, and spending hours trying to assemble a clear picture of what’s happening on your projects.
You just landed a contract for a major commercial development — an exciting opportunity but also a big step up from your typical construction project. The client wants an accurate cost estimate. You know how to estimate construction jobs, but this is different. With the project’s size and complexity, you’re worried that any figure you provide might be more guesswork than precision.
Here’s a scenario that plays out in construction finance offices more often than anyone wants to admit: a project that looked profitable at the midpoint closes out with 6% margin fade, and nobody saw it coming. Not because the team wasn’t paying attention, but rather the data they were working from was already two weeks old by the time it landed in a spreadsheet.
From a CFO or finance director’s seat, a work-in-progress (WIP) report is meant to help you translate active construction projects into real-time financial performance by connecting actual costs, percent complete, and earned revenue to show true margin health before jobs are finished. For construction companies, WIP reporting is a core signal of overall financial health and financial status.
When WIP reports are timely and accurate, you get early visibility into project progress, estimated costs, actual project costs, and revenue forecasts tied to ongoing projects.
The problem is that most construction industry finance teams still rely on manual Excel sheets and lagging ERP data to produce a WIP report. By the time reports are finalized, the insights are already outdated. The result? Margin surprises driven by cost overruns, reactive decision making, and missed opportunities to correct issues while projects are still in motion.
What a Strong WIP Report Should Include (and What Most Don’t)
Construction project management is a complex matrix of financial inputs, timelines, and risk variables that must stay aligned to protect margins and maintain predictable cash flow. An effective WIP report connects project costs, costs incurred, and earned revenue to answer critical questions about project finances, including:
Are we ahead or behind on margin by job?
Accurate WIP reports allow project managers to forecast completion costs and adjust resource allocations as needed.
Are we overbilling or underbilling relative to work completed?
Accurate billings in the construction industry are essential to reducing the risk of billing disputes and contractual obligations.
Overbilling happens when a contractor bills a client for costs that exceed the portion of work actually completed, effectively recognizing revenue ahead of performance.
Underbilling occurs when the amount billed lags behind project progress, meaning earned revenue has not yet been fully invoiced.
Which jobs are driving cash flow problems and straining cash flow management?
Routine monitoring of WIP reports can help you spot timely issues such as fade trends to see which projects are eroding profits.
What’s our revenue run rate this quarter?
WIP reports should provide a snapshot of the financial status of all active projects so companies can see if annual revenue goals will be met.
To deliver that level of insight, a strong WIP report should clearly outline the following metrics:
Total contract value
Costs incurred
Percent complete (actual vs. forecast)
Recognized revenue
Over/under billings
Projected margin vs. project budget
When these components update consistently and accurately, finance leaders and project managers can spot risk early, forecast with confidence, and protect profitability — something most spreadsheet-driven WIP processes fail to do in time.
The 5 Most Common WIP Reporting Gaps
Data silos across ERP systems, estimating tools, and spreadsheets. Finance teams spend hours reconciling disconnected data, delaying close cycles, and increasing the risk of reporting errors that mask true margin performance.
No linkage between WIP and revenue forecasts. Without this connection, revenue timing becomes unreliable, leading to inaccurate backlog projections, poor labor planning, and missed growth targets.
Static reports don’t reflect real-time changes. By the time reports reach leadership, financial conditions have already shifted, undermining cash flow planning, bonding confidence, and strategic decisions.
No variance analysis between budget and actuals. Cost overruns surface too late, causing margin erosion to compound before corrective action can be taken.
No consistency across divisions or estimators. A construction project involves many stakeholders including contractors, subcontractors, and clients. Without standardized construction accounting practices, it can be difficult to benchmark projects, forecast accurately, and meet client expectations.
Best Practices for WIP Reporting in Mid-to-Large Construction Firms
At its best, WIP reporting is more than a compliance report, it becomes a strategic lever that can help construction firms protect and scale their profitability.
Here are some best practices for effective WIP reporting:
Track job costs, revenues, and project progress at regular intervals: weekly if you’re an executive, daily if you’re a project manager.
A WIP report should always include key metrics such as total contract revenue, total costs incurred, and percentage of completion.
By automatically pulling from ERP and project systems, ContractorBI streamlines WIP creation to minimize errors, keep reports continuously updated, and improve overall financial performance. The result is real-time margin visibility, clearer revenue forecasts, stronger cash flow control, and fewer financial statement surprises as projects progress.
From Reactive to Proactive Work in Progress With ContractorBI
WIP reports shift contractors from reactive to proactive management throughout the project lifecycle. You know the old way of doing things. It’s time to adopt the new.
Old Way (ERP + Excel)
New Way (ContractorBI)
Static spreadsheets
Real-time dashboards
Margin fade surprises
Variance alerts and drilldowns
Lagging backlog data
Forecasted revenue from open bids
Manual bonding calcs
Auto-generated over/under billing reports
3-day board prep
Live dashboards for exec visibility
How ContractorBI Helps Construction Finance Leaders
Unlike project management-focused tools or generic BI dashboards, ContractorBI is built for construction finance leadership. Your projects generate massive amounts of data across estimating, accounting, and operations and ContractorBI brings it together into focused financial dashboards for WIP, cash flow forecasting, bid pipeline visibility, and more.
By integrating directly with systems you already use — like Sage 100 Contractor/300 CRE/Intacct Construction, Viewpoint Spectrum, and Procore — you get a unified, real-time view of performance without manual reconciliation. More importantly, ContractorBI connects WIP directly to your revenue forecasts and bonding calculations, so every update reflects how today’s project performance impacts future capacity and growth.
You don’t need PowerBI development, complex data models, or a team of analysts to make it work. Our platform is purpose-built for construction finance. And when questions arise, you can drill down instantly by job, estimator, division, or cost code to uncover exactly where margins are shifting and why across all construction projects.
With a tool like ContractorBI, your team will be equipped to treat WIP as a living financial model, not a monthly spreadsheet exercise.
Stop Getting Surprised by Margin Fade
WIP reporting is no longer just a compliance task; it’s a core function for financial leadership that directly impacts your firm’s profitability and forecasting confidence. When costs, revenue recognition, and project progress aren’t tracked accurately or consistently, finance teams lose visibility into margin erosion until it’s too late.
Construction accounting software like ContractorBI eliminates much of that risk by automating data flow, reducing manual errors, and keeping WIP continuously current, so that leaders like you can proactively address issues early and maintain financial control.
With ContractorBI, your team can move from reactive number gathering to proactive decision-making. Start your 14-day free trial (no credit card required) and see your WIP performance in real-time.
Why Data Analytics Matters in Construction Forecasting Software
Rising material volatility and labor constraints have made ‘gut feel’ forecasts too risky for any contractor serious about protecting margins. Plus, labor shortages continue to challenge even well-established firms. In fact, 92% of U.S. construction firms struggle to find qualified candidates according to a 2025 workforce survey by the Associated General Contractors of America and National Center for Construction Education and Research.
Controllers and CFOs can no longer rely on static assumptions built into last year’s spreadsheets. Construction forecasting software with embedded data analytics replaces those static spreadsheets with continuously updated insights. Instead of manually pulling job cost data once a month, these platforms ingest real-time data from accounting, estimating, and field systems to recalculate forecasts automatically.
The typical pain points for controllers are well-documented:
Manual job-cost rollups that consume days each month
Inconsistent productivity assumptions across project managers
Reactive margin corrections discovered too late to address
Data silos between field teams and the accounting office
Data analytics surfaces patterns in job performance, win rates, and backlog trends that humans miss when working from siloed reports. Disconnected data also leads to cost overruns; McKinsey reported that large construction projects may run up to 80% over budget and take 20% longer to complete. Firms using forecasting software can take control of these costs.
Core Components of Construction Forecasting Software for Controllers
Construction forecasting software today is built on specific data building blocks that work together to produce more accurate forecasts. Understanding these components allows controllers to better evaluate tools and set-up effective forecasting workflows.
Data Source
What It Provides
Forecasting Application
Bid history
Original estimates, unit costs, labor hours
Baseline for cost and revenue projections
Awarded contracts
Contract values, billing terms, schedules
Revenue timing and backlog calculations
Change orders
Scope adjustments, approved dollar amounts
Updated contract value forecasts
Labor productivity
Hours per unit by trade, crew, task
Labor demand and cost projections
Equipment usage
Machine hours, rental costs, utilization
Equipment budget forecasting
Pipeline opportunities
Future bids, probability weights, timing
Weighted revenue and capacity planning
These data components feed job forecast calculations, cash flow projections, and labor plans month by month. For example, for cash flow forecasting you shouldn’t solely rely on when receivables are due; you need to consider customer payment history.
Automated data ingestion from estimating, accounting (such as Sage 100 Contractor/300 CRE/Intacct Construction or Viewpoint Spectrum), and project management platforms eliminates manual entry errors. The software pulls actual costs and production quantities directly from source systems, keeping forecasts aligned with what’s happening in the field.
A typical data-flow architecture moves information from field apps and office systems into a central analytics engine, where it’s processed into dashboards and reports that controllers can review instantaneously.
How ContractorBI Uses Data Analytics To Power Construction Forecasting
TopBuilder’s ContractorBI™ is a construction forecasting software and business intelligence tool purpose-built for contractors. It provides the analytics layer that connects financial, operational, and sales data into a unified view for controllers and CFOs.
ContractorBI integrates three main data streams:
Historical bid data – Past estimates, awarded projects, and win/loss records
Job performance history – Labor hours, costs, and production metrics from completed and active jobs
Future project pipeline – Opportunities, probabilities, and projected start dates
The software calculates job forecast calculations using Earned Value Management principles. It compares Planned Value (how much you spent) against Earned Value (how much actual work you’ve completed) and Actual Costs (actual dollars or hours spent) to identify variances early.
Rather than applying flat assumptions, ContractorBI uses construction job cost accounting principles to project cost-to-complete and final margin. Dashboards available through the ContractorBI dashboard library include project-level financial tracking, labor forecasting, revenue projections, and more.
Integrating Bid Data for More Accurate Revenue and Cash Forecasts
ContractorBI imports historical bid logs and awarded projects from TopBuilder CRM or other bid-management tools. This creates a complete record of what was estimated, what was won, and what actually happened on each job.
Win rates are calculated by customer type, project type, and geography. Let’s say a contractor might win 60% of government work but only 35% of private bids. These rates weight future pipeline revenue forecasts so projections reflect realistic outcomes rather than wishful thinking. For controllers, this means turning a raw bid list for 2025 and 2026 into a probabilistic revenue forecast by month or quarter. A $10M opportunity with a 40% win probability contributes $4M to the weighted forecast, not the full amount.
Using Historical Job Performance and Bidding Data To Refine Labor and Cost Forecasts
Past job performance is the strongest predictor of future labor needs on similar work. If your crews consistently install 200 linear feet of ductwork per day on commercial projects, that’s the rate that should drive your labor forecasts.
For these forecasts, ContractorBI considers:
Active jobs in your accounting system
A weighted forecast of bidding activities
Historical job performance to calculate projected probability
Connecting Project Pipeline Metrics to Cash Flow and Capacity Planning
Pipeline analytics in construction forecasting software links future work to revenue timing, cash needs, and staffing requirements. Without this connection, controllers often discover capacity constraints or cash crunches too late to respond effectively.
ContractorBI lets users map estimated start dates, durations, and contract values for each opportunity in the pipeline. These pipeline metrics roll into time phased budgeting for monthly revenue, billings, and cash receipts based on user-defined billing curves.
The result is a forecast showing how confirmed backlog plus weighted pipeline creates a 12-18 month revenue outlook. Controllers can quickly see when projected workload exceeds field capacity (and vice versa) and adjust hiring or subcontracting plans accordingly.
Practical Workflow: Building a Data-Driven Construction Forecast With ContractorBI
Here’s a step-by-step guide for controllers and CFOs implementing construction forecasting software for the first time. The workflow moves from connecting data sources through running forecasts and collaborating with operations leaders.
The typical implementation path includes:
Cleaning and validating historical data
Connecting data sources and import clean data
Configuring standard metrics and assumptions
Running an initial forecast
Iterating with project teams and operations leaders
Most mid-sized contractors can complete initial setup within a few weeks if data sources are accessible and someone owns the cleanup process.
Step 1: Clean and Validate Historical Job Data
Analytics are only as reliable as the job-cost and production data feeding them. Before relying heavily on forecasts, controllers need to complete these data cleanup activities:
Close out old jobs that are still open in the system
Correct negative cost entries from accounting errors
Standardize unit measures across projects (square feet, linear feet)
Verify that labor hours tie to payroll records
Ensure change orders are properly recorded against contracts
Software like ContractorBI can flag inconsistent or missing data, such as cost codes without quantities or jobs without recorded labor hours. A 60-90 day historical review typically catches most issues.
Once the initial cleanup is complete, ongoing data-quality issues are easier to spot through exception reports in the dashboards.
Step 2: Connect Accounting, Estimating, and CRM Systems
Accurate construction forecasting depends on synchronized data from accounting, estimating, and CRM platforms. Manual re-entry defeats the purpose of analytics-driven forecasting.
ContractorBI connects to common systems including Sage (100 Contractor/300 CRE/Intacct Construction), Acumatica, Viewpoint Spectrum, Vista, Procore, and TopBuilder CRM via secure integrations. Controllers should validate that job cost codes, cost types, and customer names are aligned across systems before running forecasts.
Once connections are configured, data refreshes run automatically on a real-time and daily schedule, depending on the data source. This provides real-time insights without manual intervention, so forecasts always reflect the latest field activity and financial transactions.
Step 3: Configure Forecasting Rules and Assumptions
Controllers should define global forecasting rules that the software applies consistently across jobs and time periods. These rules create standardization while still allowing flexibility.
ContractorBI lets users override global assumptions on individual projects where unique risks or contract terms apply. A complex renovation might need different productivity assumptions than new construction.
Document these assumptions so that any controller or CFO reviewing the forecasts understands how they’re produced.
Step 4: Review Forecast Dashboards With Operations Leaders
The best construction forecasting software supports collaboration, not just finance-side reporting. Project managers and superintendents bring field knowledge that validates or challenges forecast assumptions.
Controllers can use ContractorBI dashboards during monthly operations and planning meetings to review job forecasts and job cost performance live. The team can drill into over-budget line items, crew-level productivity, and expected cost-to-complete directly from the dashboard view.
Key dashboard types for these reviews include:
Current and completed job-level job cost performance
Cash flow projections and cash requirements
Project progress and cost to complete tracking by phase
Revenue forecast using active jobs and job in the bidding cycle
Revenue opportunities (gaps in bidding activity)
In a typical monthly review, a forecast might warn of a 3% margin fade on a mechanical project. The team investigates, identifies job cost performance issues, and adjusts cost overruns before any variance grows larger.
Key Analytics Dashboards in ContractorBI for Controllers and CFOs
ContractorBI provides several dashboards that convert raw construction data into at-a-glance views supporting fast and informed decisions. Each dashboard serves a specific purpose for financial leaders overseeing multiple projects simultaneously.
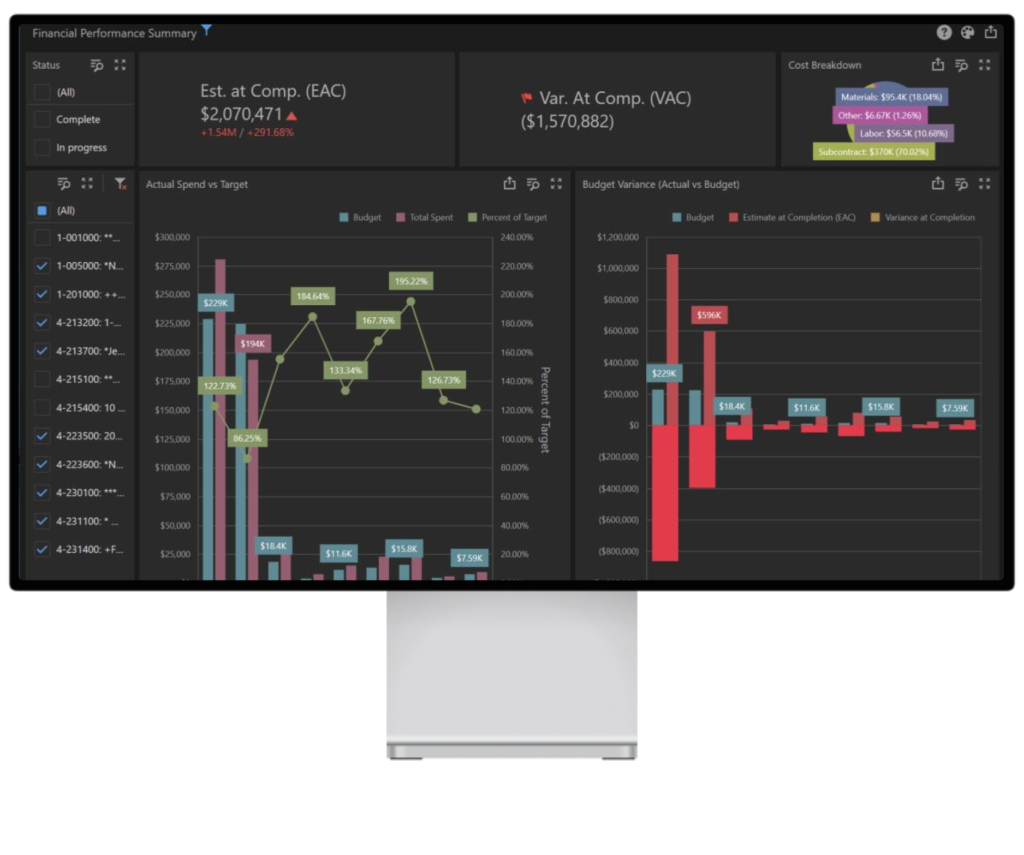
Financial Health & Performance Dashboard
The Financial Health & Performance Dashboard delivers live, consolidated visibility into revenue projections, cash flow trends, job profitability, and cost control, allowing finance teams the insights needed to act early and plan confidently.
It solves common challenges such as:
Unanticipated cost overruns and shrinking margins
Limited visibility into project liabilities and financial exposure
Difficulty forecasting revenue and managing cash flowGaps in budgeting and
long-term financial planning
Slow, manual reporting cycles that delay decision-making
Critical financial ratios and KPIs
It helps answer critical questions like:
Are we financially on track to hit our targets?
Where are we most exposed to budget risks or shortfalls including working capital requirements?
Which business areas are underperforming?
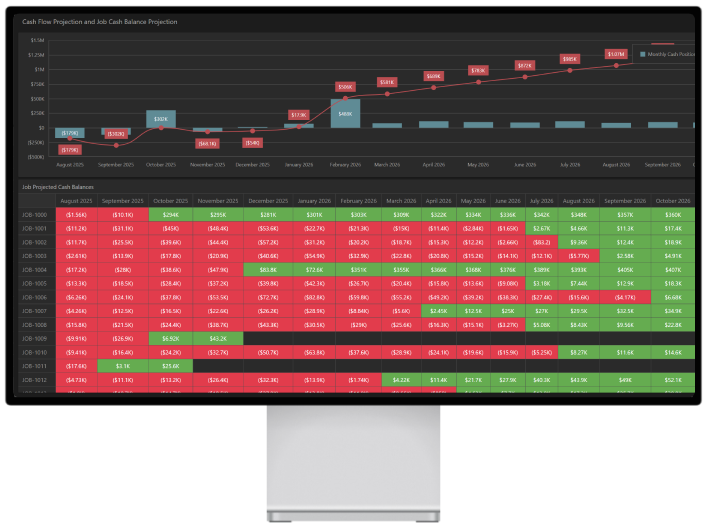
Cash Flow Projection and Job Cash Balance Projection
This dashboard gives controllers a clear, real-time view of cash flow by pairing projected month-end balances with month-by-month cash movement. It makes it easier to spot key turning points — when the business moves from tight to comfortable — and flags low-revenue months sooner.
The job-level heatmap then connects the dots between project performance and the overall cash picture. By showing projected cash contribution by job and month, and calling out negatives versus positives, it quickly highlights which jobs are creating cash strain now, which are expected to recover, and which may be structurally cash-negative.
Together, this chart turns forecasting into action to solve problems like:
Planning payroll, vendor payments, and credit line activity before timing becomes a problem.
Attending to billing cadence, collections, change orders, or cost timing.
Controllers can focus invoicing and AR follow-up where it matters most, confirm that billing schedules align with the forecast, and make strategic decisions about payment timing and working capital. The result: leadership gets not just a reliable cash outlook, but a more-informed plan to improve it.
Business Benefits of Analytics-Driven Construction Forecasting Software
Data analytics in construction forecasting software delivers measurable financial and operational gains. These benefits extend beyond the finance department, supporting project managers, estimators, and executives through shared, transparent forecast data.
Benefits include:
Improved forecast accuracy
Stronger margin protection through early variance detection
Better cash control and working capital management
More confident growth planning with data-backed scenarios
More Predictable Margins and Fewer Late Write-Downs
Analytics-driven job forecast calculations reduce the gap between forecast gross margin and actual results at job close. Early detection of cost overruns at the line-item or crew level lets teams adjust staffing, productivity, or change-order strategy before margins erode.
When analytics detect a 3% margin fade mid-project, targeted interventions — reassigning crews, accelerating change order processing, or adjusting resource allocation — can preserve a significant portion of that margin by completion.
More predictable margins support stronger banking relationships by demonstrating financial control. They also enable more accurate incentive compensation plans tied to project performance rather than surprises at closeout.
Faster WIP, Month-End Close, and Board Reporting
ContractorBI centralizes the data normally collected via multiple emails and spreadsheets. WIP schedules, forecast reports, and executive summaries generated from live dashboards instead of manual compilation.
The time savings are substantial. Controllers report reducing WIP preparation from multiple days each month to only a few hours of review and commentary. Export options include Excel, PDF, and as a graphic so reports can be added to presentations or shared with colleagues.
This efficiency frees up finance leaders to focus on analysis and strategy rather than data wrangling. When potential issues appear in the data, there’s time to investigate rather than just document.
Better Strategic Planning for Growth and Capacity
Multi-year revenue, labor, and cash forecasts support longer-term strategic decisions. Controllers and CFOs can model scenarios for opening new branches, purchasing equipment, or adding new self-perform trades.
For example, a contractor might use ContractorBI’s forecasts to justify hiring an additional estimator based on projected bid volume, or to evaluate opening an office in a high-growth region where pipeline opportunities are concentrated.
Strategic planning is strengthened by showing data-backed scenarios to stakeholders instead of relying on optimistic projections alone. This allows controllers and CFOs more control over the company’s future trajectory with confidence in the underlying numbers.
Getting Started With ContractorBI Construction Forecasting Software
Ready to explore ContractorBI in greater depth? The typical onboarding journey includes a discovery call, data review, and rollout to finance and operations teams.
What To Prepare Before a ContractorBI Demo
Coming to the demo with real information makes the session more valuable. Gather these items before scheduling:
Sample WIP reports from recent months
Current backlog report by project
Bid log showing active opportunities
List of primary accounting and estimating systems
Identify two to three recurring forecasting pain points to focus the demo.
Common examples include labor overruns, inconsistent revenue projections, or cash crunches at specific points in the project cycle.
Streamline Financial Decision-Making With Construction Data Analytics Software
Manual spreadsheets, disconnected systems, and slow reporting cycles still define how many construction teams manage their financial data. According to one report from FMI, the industry captures vast amounts of information each day, yet nearly 96% of it goes unused, leaving leaders without the insights they need.
Best Practices for Financial Reporting in Construction (Break Free From Manual Reports!)
Financial clarity has never been more critical in a tightening construction market where developers are slowing new project planning. Many construction companies still rely on manual financial reporting practices that can’t keep pace with today’s pressures.